A sideways look at economics
Last December I was debating with some friends who among us swore the most. Naturally, no one accepted any of the accusations thrown their way and the conversation reached no consensus. As a Fathom economist and a data nerd, this got me thinking: there must be a way to answer this question empirically. That’s when I realised that I actually do have a treasure trove of untapped data that I could use to answer this question: our WhatsApp group chat.
For better or worse, in this digital age we are creating data points constantly, with every message, click and search. Putting ethics to one side, this creates a goldmine of data that I can use to uncover answers, patterns and observations that are hiding in plain sight. So that is exactly what I did using my friend-group’s WhatsApp chat, and here are some of the most interesting findings. For the sake of my friends, names have been redacted and necessary permissions have been obtained.
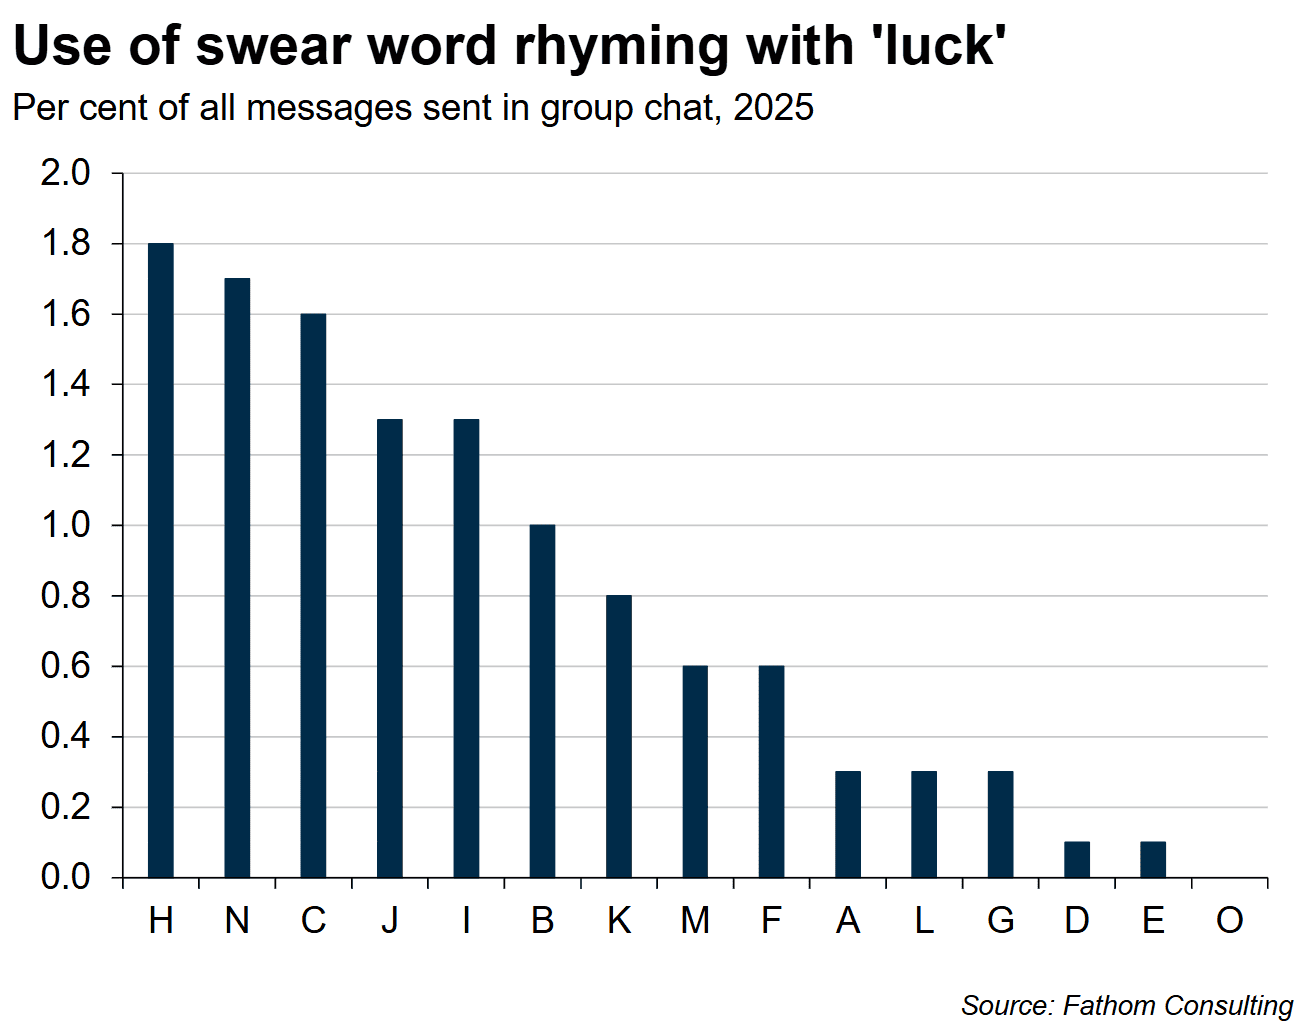
After loading a transcript of our group chat into R and doing some cleaning and processing, it was time to answer the question that started all this: who swears the most? To answer this, I counted the use of a certain word that rhymes with ‘luck’ as a percentage of all messages for each member of the group chat. The chart below has our results, and Person H is the guilty party. Interestingly, nobody except Person H was surprised by this result. To give them some consolation, in absolute terms it was actually Person C who used the word the most times. The jury is out on which of the two statistics is more damning.
It can be very satisfying when the analysis backs up our initial hunch, like in the case of Person H, but more interesting are some of the other questions that can arise after looking at the data. For example, after looking at the number of messages sent per group member, I wonder if Person A is the ‘life and soul of the party’ or actually just needs to get a real job; and whether Person N and Person O even like the rest of us.

Another piece of analysis that I thought was interesting was to see how the messages in the group chat evolved over the year. It seems like our usage of the group shot up as the UK got warmer, which makes sense as we all planned to meet up more and do things together in the sun. However, the drop-off as we entered the colder, darker winter period is also a suggestion to put more effort into staying in touch with one another when perhaps we need it most.

With modern machine-learning models there’s so much more I want to do with this data when I get some time: for example, running a sentiment analysis to see what tone people tend to use on the group, or a clustering analysis to see what kind of sub-groups lie within the group chat (although the latter may stir up some drama).
So what does any of this have to do with economics? Well, a lot, the way I see it. Economists have often been criticised for being too hand-wavey or reliant on models that are underpinned by an array of unrealistic assumptions. Although these models certainly have their place in explaining how society functions, the modern economist must have the tools required to leverage data and combine it with robust analysis to support their investigation. Thinking creatively about the kind of data and analysis we can use to get at a complex question is a big part of the day job for economists, especially here at Fathom. This not only helps us be more confident about our assertions, but also allows us to see conclusions and raise new questions that would otherwise remain hidden. Whether it be using group-chat data to understand my friends’ choice of words, scraping earnings reports to gauge corporate heath, or using mobility data to nowcast GDP, there will always be a way to use data to help answer the question at hand; and figuring out how to do that is the part of my job I enjoy the most.
More by this author