A sideways look at economics
Ever since I was introduced to the idea as a student of A-level economics, I have long been intrigued by the clear, inverse relationship between the hours worked by an individual, and the amount that he or she produces per hour. As someone interested in his own work/life balance, as well as that of the company more broadly, I’ve often wondered: can we work less, yet produce more? The past ten years have seen a growing interest in the production of (very) long-run datasets of economic and financial market variables. Officially, we know very little about the UK economy before 1948, because that is the earliest year for which the Office for National Statistics publishes an estimate of UK Gross Domestic Product, or GDP. Unofficially, we know a good deal more thanks to the efforts of dedicated researchers.
These include those at the Macro History Lab in Bonn. This organisation makes available on its website the Jordà-Schularick-Taylor Macrohistory Database, which contains information on 25 macroeconomic and financial market variables, including the expenditure components of GDP, equity prices, house prices, long- and short-term interest rates, and levels of both public and private sector debt. The data are available for 17 advanced economies and cover the period since 1870. Shaken, perhaps, by the magnitude of the Great Recession of 2008/09, it seems that economists are now willing to trade a certain degree of precision for the ability to see much further back in time. And rightly so in my opinion.
In this week’s Thank Fathom it’s Friday, we make use of another freely-available archive of facts and figures to explore an interesting phenomenon that emerges only when one takes a longer-run perspective on, in this case, the UK economy. Described with only a modicum of poetic license as ‘a Millennium of Macroeconomic Data’, the Bank of England’s own database includes estimates of many UK economic and financial market variables, in many cases stretching back several hundred years, and in one or two cases right back to 1086.
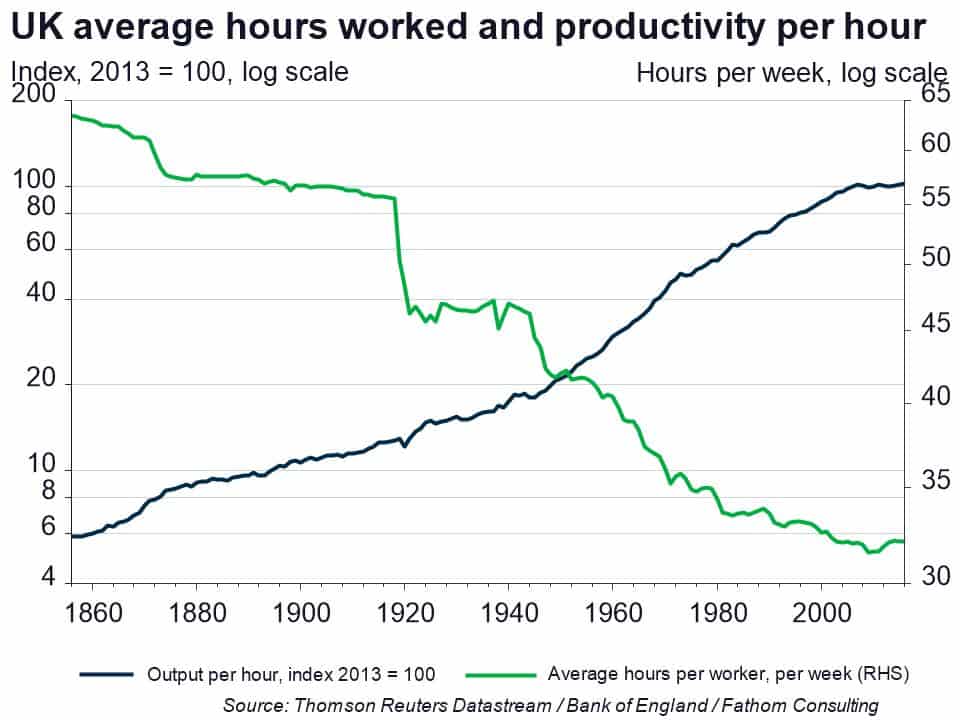
As I wrote in this blog a year ago, the inverse relationship between the hours worked by an individual, and the amount that he or she produces per hour can be seen across countries at a single point in time. But with help from a ‘Millennium of Macroeconomic Data’, we can go a little further. It’s also, as our chart demonstrates, evident in a single country through time. Since the 1850s, the length of the UK working week has approximately halved, from just under 64 hours to just over 32. At the same time, productivity per hour has risen almost twentyfold.
What might explain the relationship apparent in our chart? I can think of two broad candidates. One is that the decision to work fewer hours is a rational response to an exogenous improvement in productivity. So changes in productivity cause changes in hours worked. In the language of consumer choice theory, the income effect that follows an increase in the wage rate, which doubles as the price of leisure, dominates the substitution effect: individuals chose to buy more leisure and work fewer hours. We might call this the ‘consumer choice’ explanation. The other is that the ability to produce more per hour is a natural, human response to an exogenous reduction in the length of the working week. We are not machines, after all. Here changes in hours worked cause changes in productivity. We might call this the ‘exhaustion effect’ explanation.
So much for the theory. Which explanation is true in practice? In the case of the UK at least, it appears to be a bit of both. The question of true causality is inherently philosophical in nature. Econometrics tells us nothing about true causality. Instead econometricians tend to invoke the weaker concept of Granger causality, named after the late British econometrician and Nobel prize winner, Sir Clive Granger. If some variable of interest, X, is found to be statistically significantly useful in predicting changes in some other variable of interest, Y, then variable X is said to Granger-cause variable Y. Applying these tests, we find that changes in average hours help predict changes in productivity, and changes in productivity help predict changes in average hours. Changes in average hours Granger-cause changes in productivity, and changes in productivity Granger-cause changes in average hours.
Something else apparent from our chart is that, since the Great Recession of 2008/09, productivity per hour in the UK has stopped rising and average hours worked have stopped falling. As regular readers will be aware, Fathom’s view is that a decade of near-zero interest rates has caused more harm than good. By allowing inefficient firms to survive, it has depressed productivity across the major economies. In the context of the model set out above, an end to the upward trend in productivity has caused an end to the downward trend in hours worked. Not only has the productivity crisis caused real rates of pay in the UK to stagnate for ten years, it has caused UK workers to work longer than they would have done had the upward trend in productivity continued in an attempt to claw back some of their lost earnings. Using the coefficients from our simple statistical model described above, we find that what is now a 20% shortfall in productivity, relative to its pre-crisis trend, has added almost one hour to the length of the UK working week. Yet more evidence, were it needed, that interest rates really have been too low, for too long!