

A sideways look at economics
It’s a bubble. The valuation of AI stocks implies implausible growth in future earnings, without which the capex already undertaken and planned will not deliver the returns they need. It could be rational; it could be psychological: either way, it’s a bubble. But when will it burst? That is the trillion-dollar question, and the answer might be: right now. Here, I look at some of the metrics around how likely the bubble is to burst in the next period.
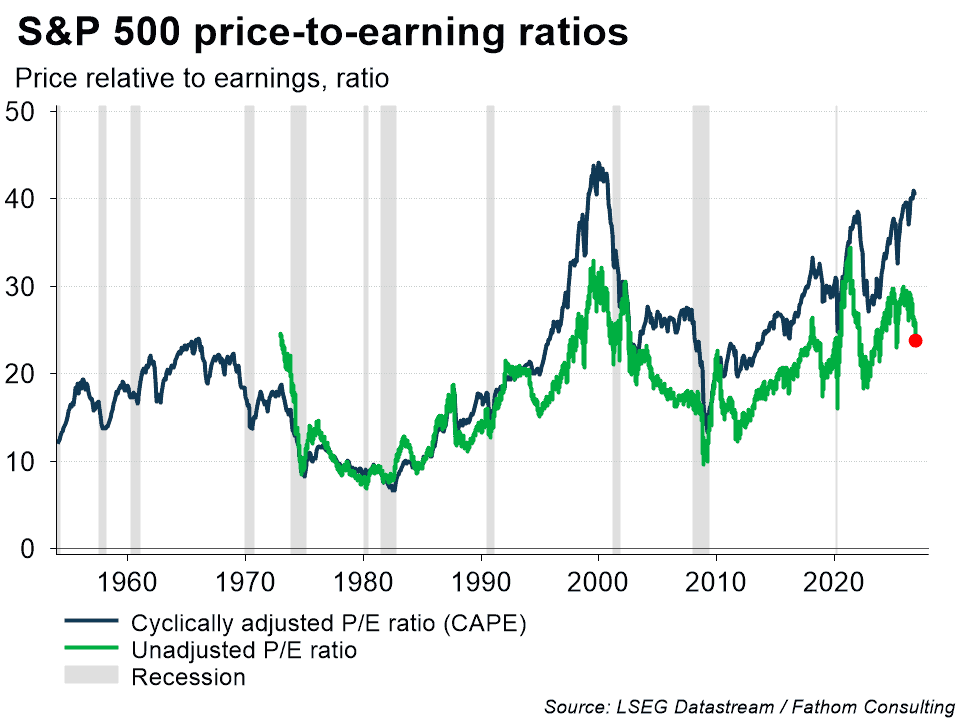
What can we learn from the magnitude and duration of historical upswings in the cyclically adjusted price-to-earnings ratio (CAPE) for the S&P 500, specifically? The current upswing is six months old, and only one in three previous upswings have lasted longer than that, though some have extended out to 19 or 20 months. The peak-to-trough reduction in CAPE after it tops out (the mean-reversion) depends on how far above the mean that ratio starts. Last month, CAPE was 2.3 standard deviations above its mean, a level which it occupies less than 2.5% of the time. If it bursts now (as might be happening), the peak-to-trough fall is likely to be large. If the bubble continues to inflate, both the likelihood of bursting and the extent of the fall will increase.
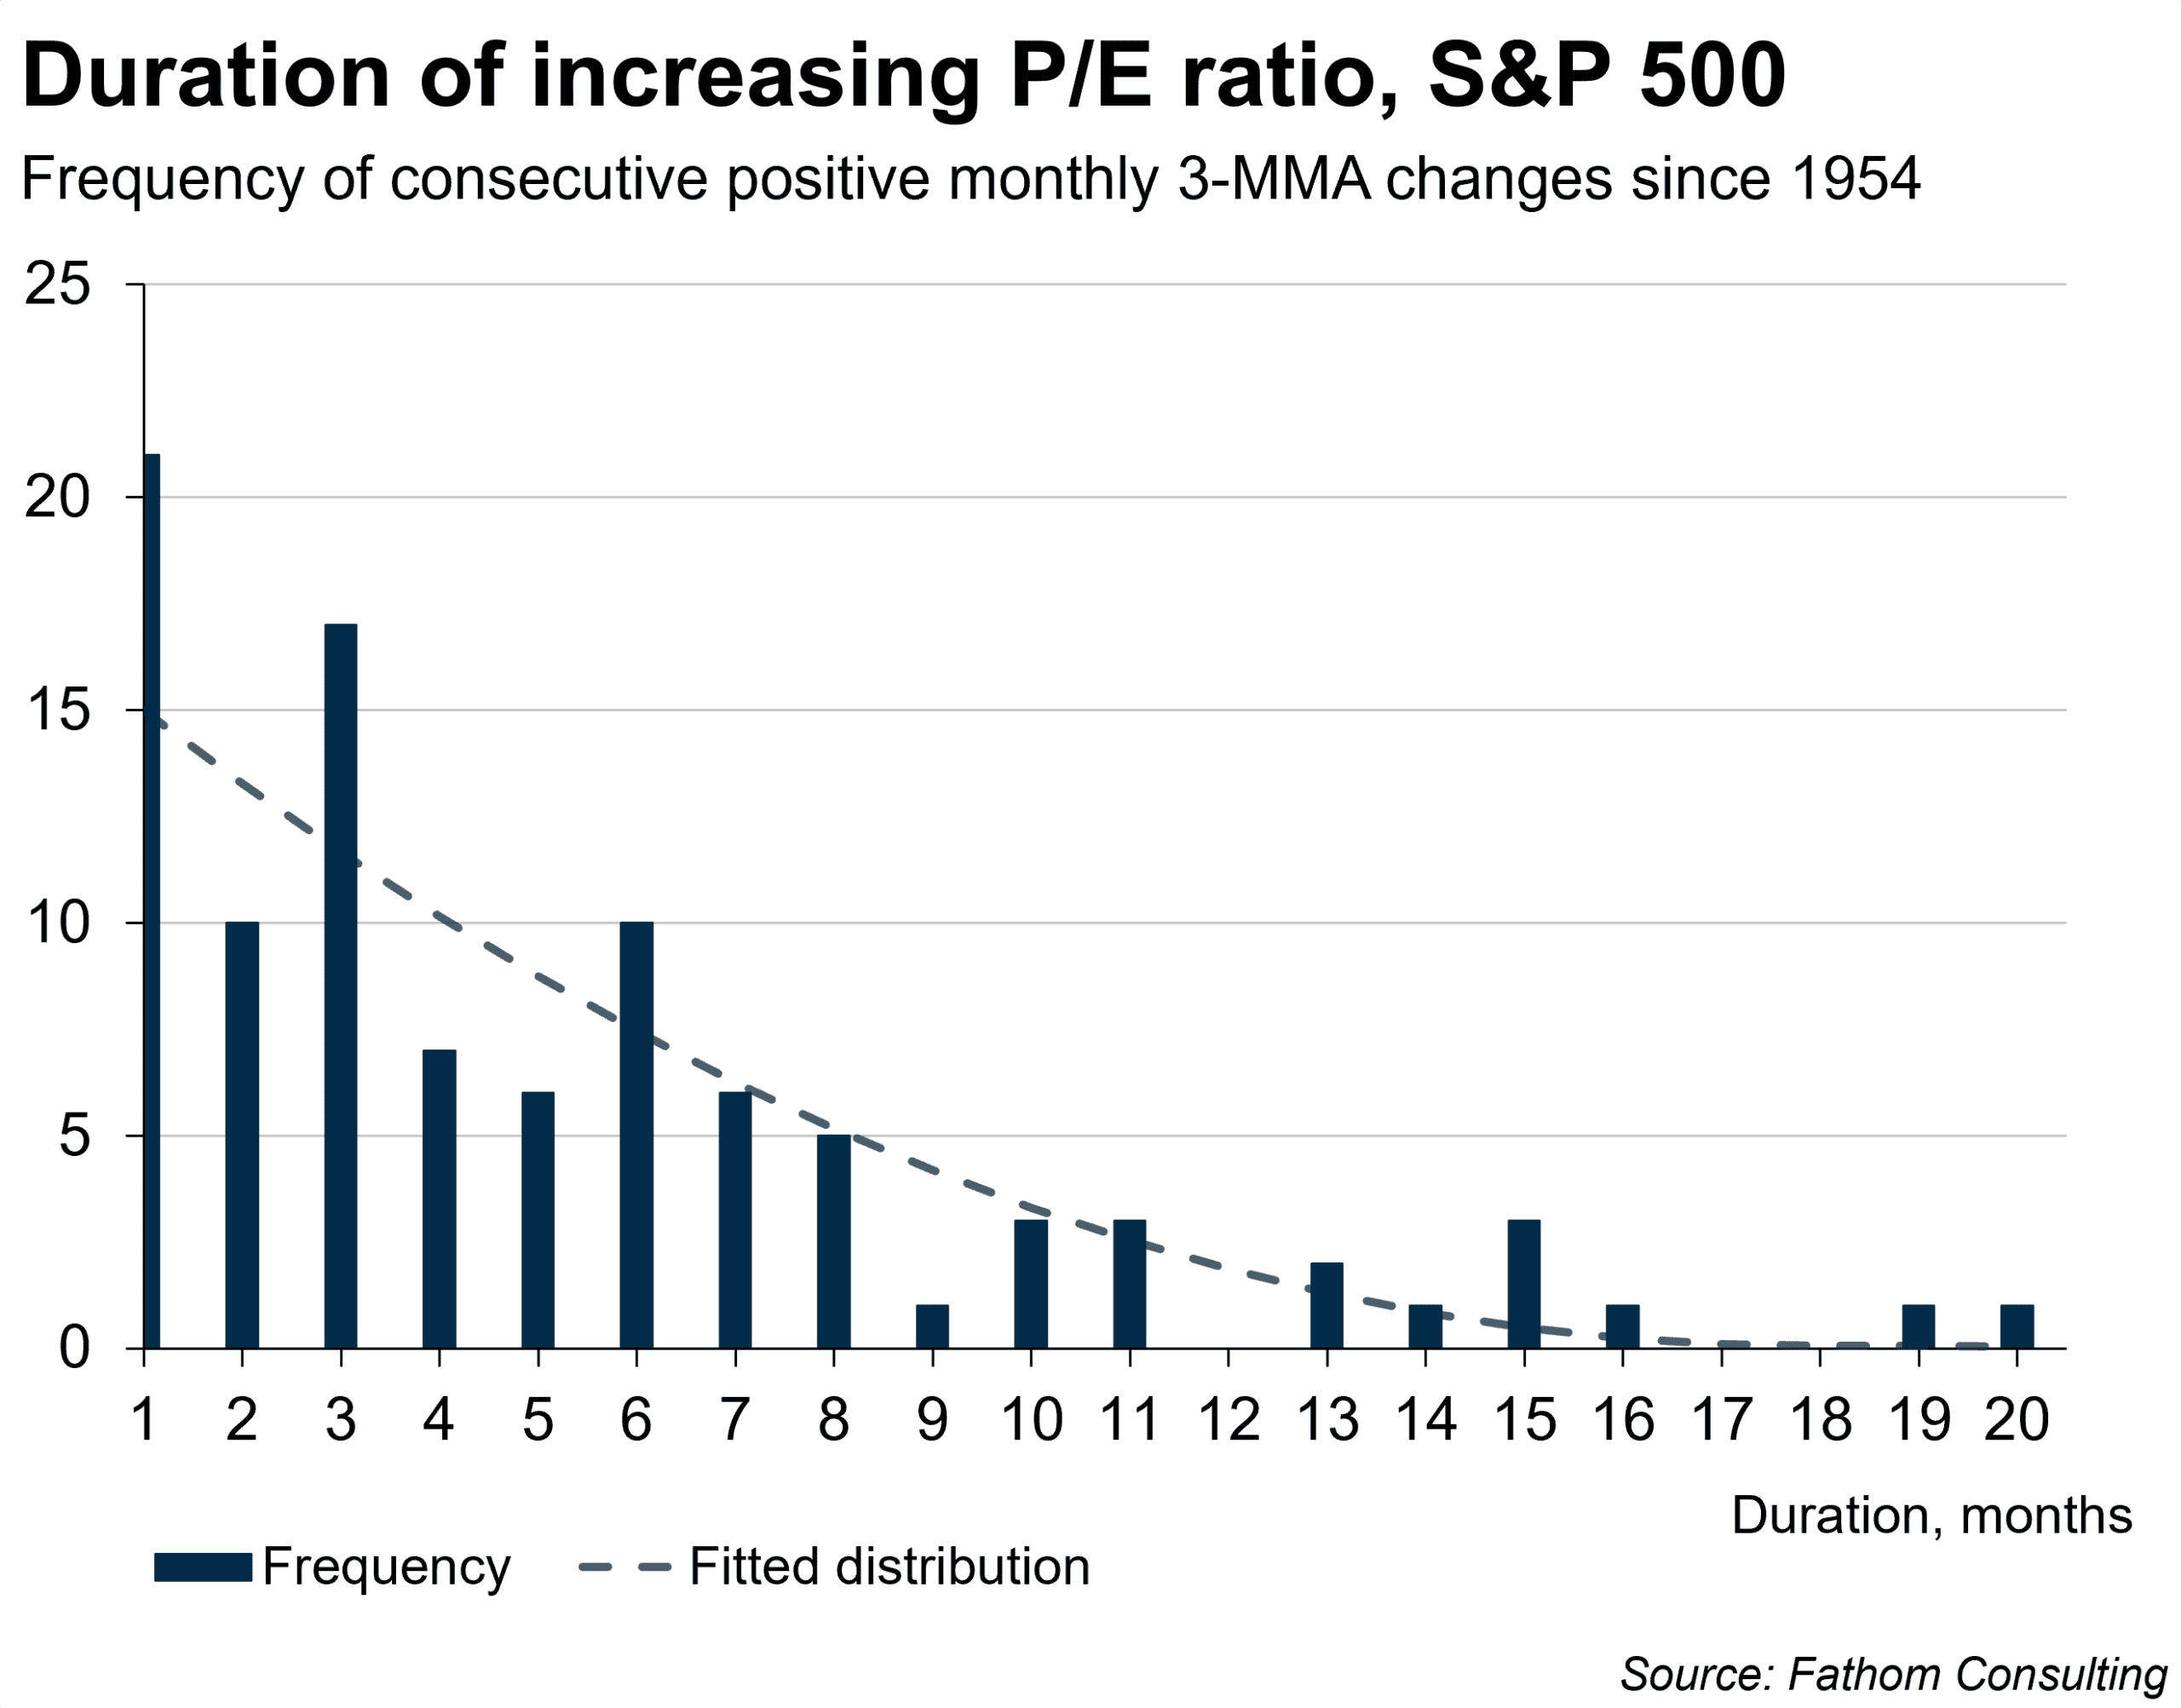
The average duration of continuous upswings in the three-month moving average of the Shiller S&P500 CAPE ratio since 1954 is 5.1 months. The chart below is a histogram of the duration of upswings in this concept: there have been twenty-one episodes since 1954 when the upswing has lasted only one month; ten episodes of two-month upswings, and so on. (The bars represent the observed frequency of different durations; while the dashed line is an estimated line of best fit, a guide to what the expected future frequency might be.) The current upswing in this concept is six months old. 70% of observed upswings, and 67% of expected future upswings, are of six months’ duration or less.
The starting level of CAPE matters: first, for the likelihood of an upswing continuing; and second, for the likely magnitude of the peak-to-trough fall should it end. The chart below shows the frequency of durations of upswings that are already six months old, cut according to the level of CAPE at six months into an upswing. There have been ten episodes since 1954 when a six-month-old upswing stopped at six; six episodes where it continued for one more month; five when it continued for another two months, and so on. But, since 1954, there have been only three episodes (including the one we are now in) where an upswing has lasted as long as six months, when CAPE was more than two standard deviations above its mean at six months into the upswing. These are represented by the purple bars on the chart. Of those three episodes, one lasted for a further two months, one for a further three, and the last is the upswing we are now in, so it remains to be seen how much longer it will last, if it is not already over.
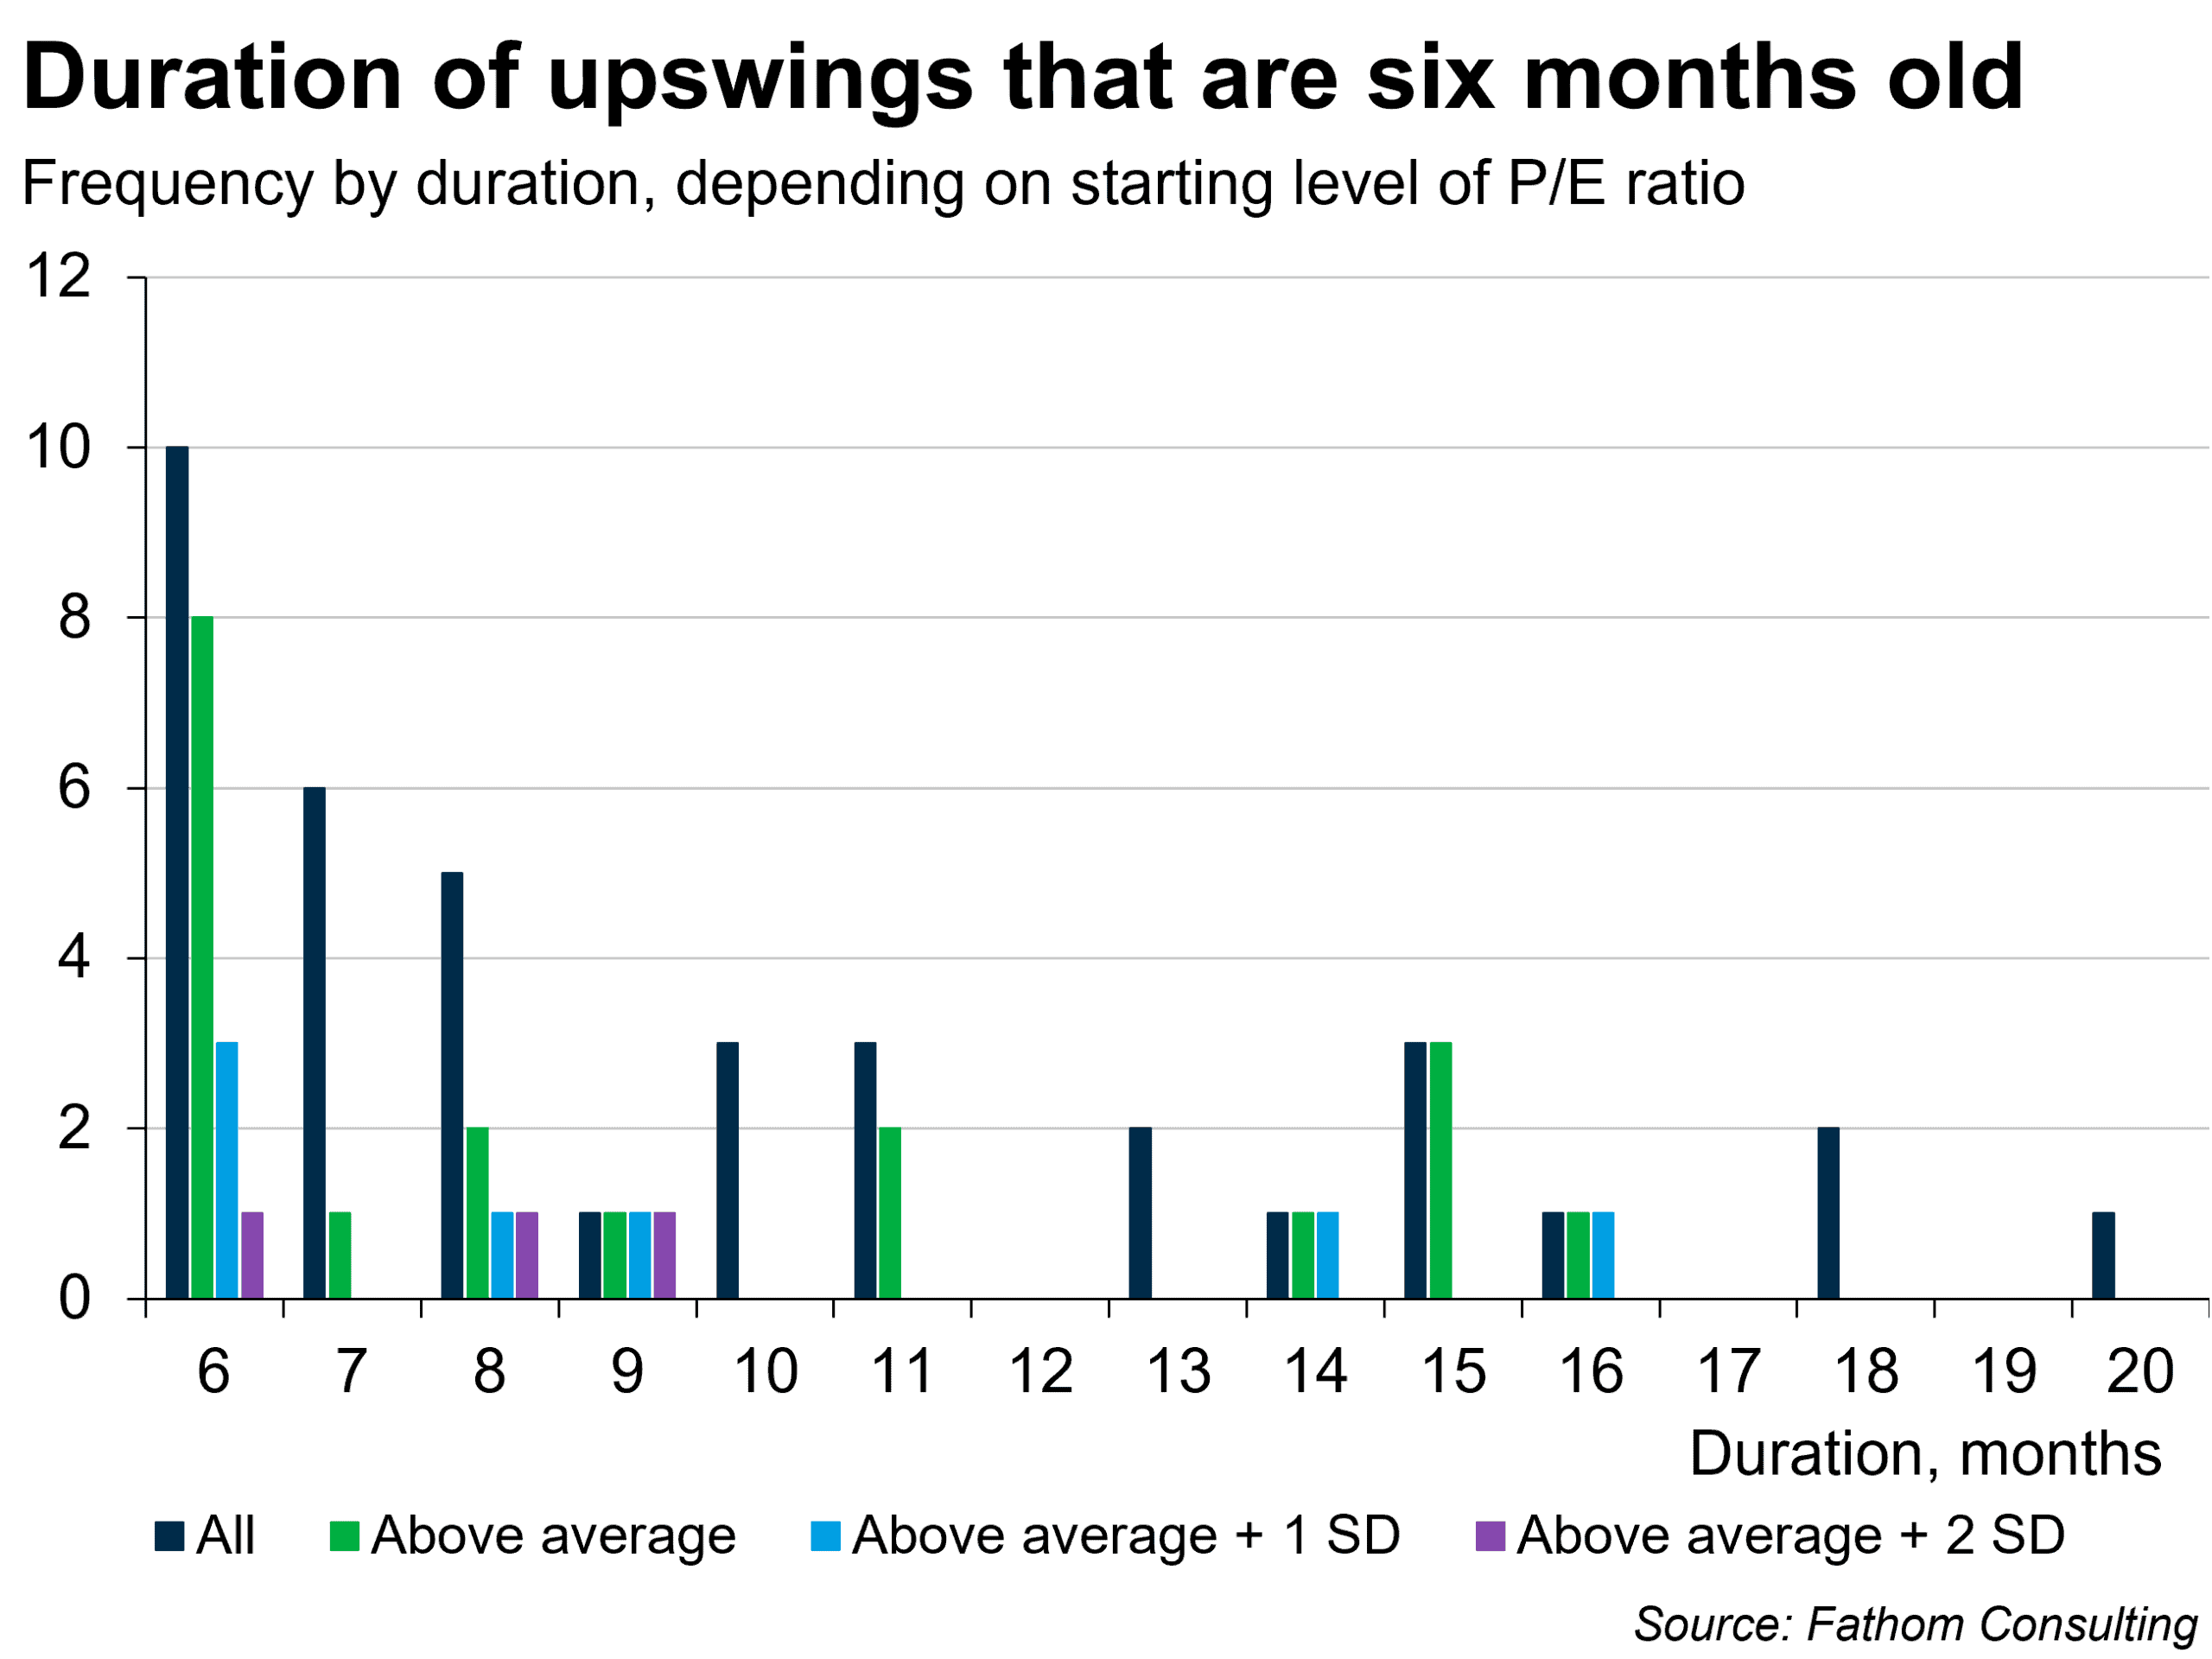
A sample of three episodes is obviously very small, especially since one of them is still under way. It is slightly safer to draw inferences from episodes where the ratio is above average plus one standard deviation after six months, of which there are seven (the pale blue bars, of which the purple bars are a subset). Of those, two were over in the sixth month, another four went to eight, nine, fourteen and sixteen months respectively, and the last is the upswing we are now in. All told then, for the upswing that we are now in, historic frequencies suggest there is a 33% chance that the correction starts this month; a 33% chance that the upswing continues for another two to three months; and another 33% chance that it continues for up to a year from now. There are no historic examples of an episode like this lasting for more than another year (which does not imply that it cannot happen, of course: the sample is still tiny and tail events are eminently possible).
It might be considered rational, by investors with a high tolerance for risk, to continue investing in the bubble until the moment arrives when the chance of correction in the next period exceeds 50%. On this analysis, we are not quite there yet, although the sweeping Democratic gains in the US mid-term elections might have changed that calculus. However, the rational incentive to continue investing dwindles as the prevailing interest rate increases. The pin is approaching the balloon: perhaps it has just made contact.
The historical evidence, such as it is, suggests that the correction will probably occur some time during the coming year. But the degree to which the market corrects, or mean-reverts, after a sustained upswing in CAPE also depends in part on how far above average it reaches at its peak. The CAPE ratio stood at 40.7 last month. The average continuous peak-to-trough fall is 18% of one standard deviation in the three-month moving average of CAPE, reducing that ratio by 1.5. But if the ratio is above average, that increases to 24% of a standard deviation, reducing CAPE by 2. From a peak that is more than 1 standard deviation above average, the fall is larger still at 38% of a standard deviation, reducing CAPE by 3.2. And, from a starting point more than 2 standard deviations above the mean (where it now stands) the average continuous fall after the peak is 42% of a standard deviation, reducing CAPE by 3.5.
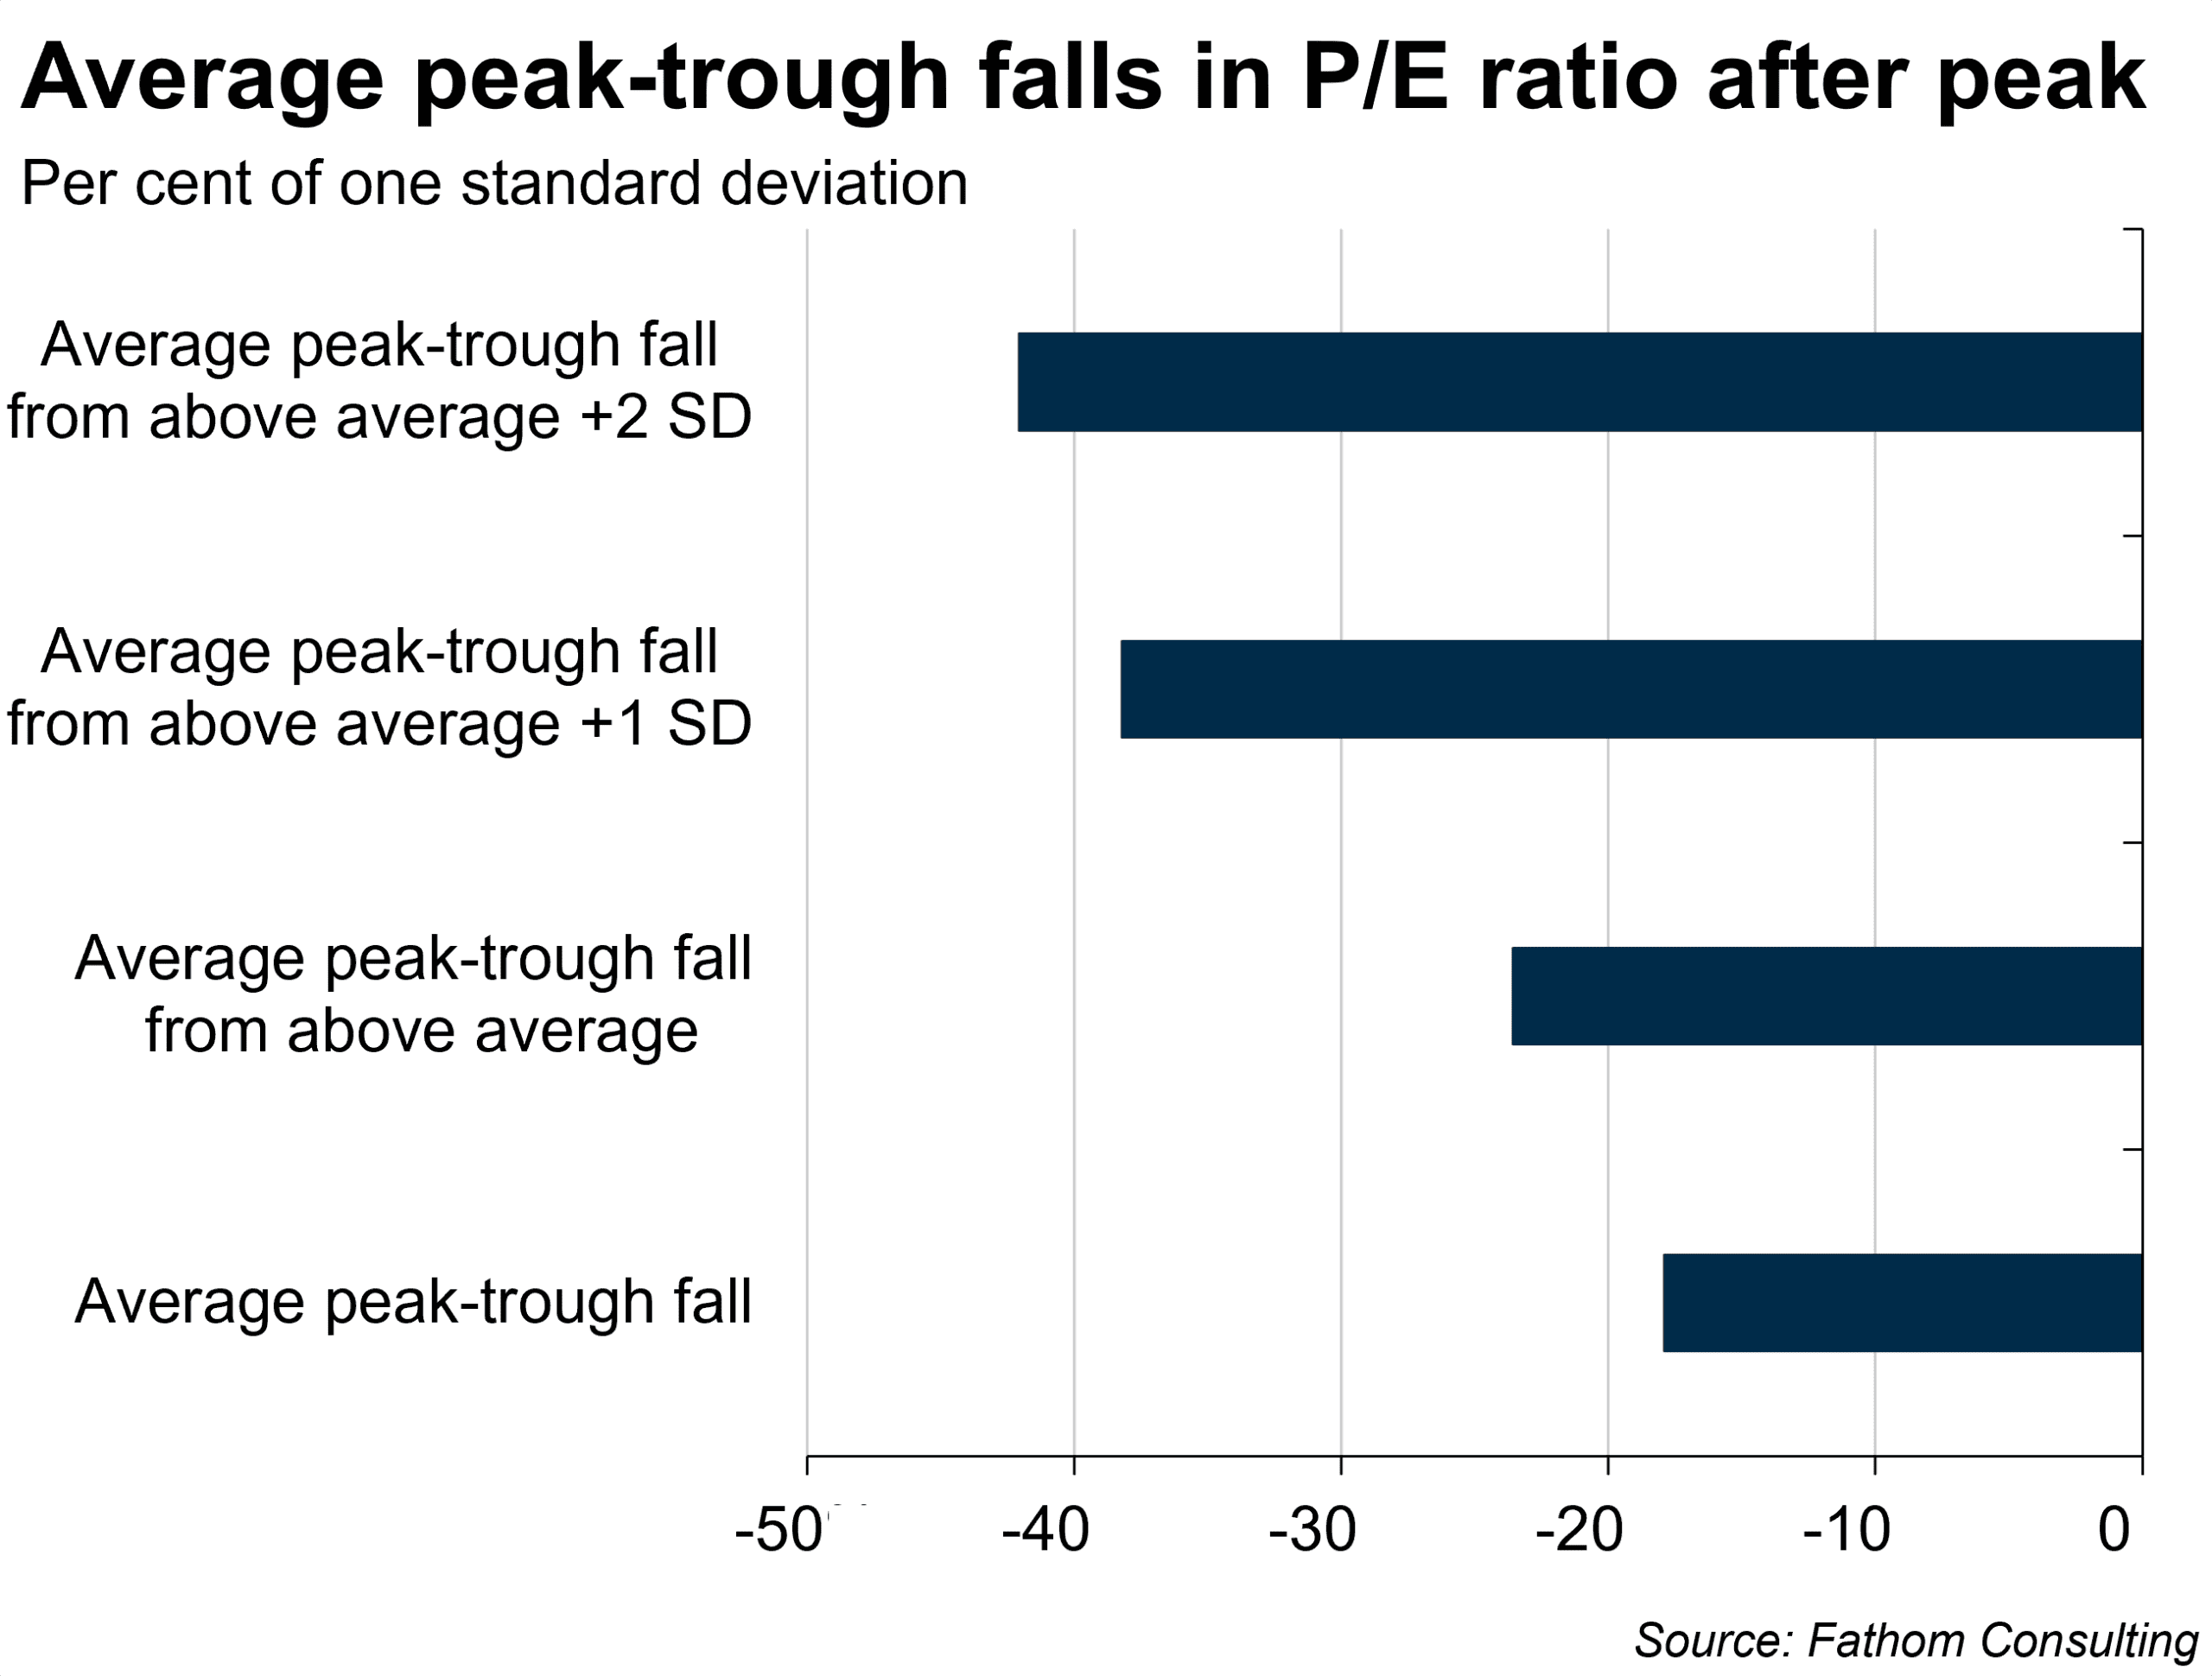
If a correction were to start, we would expect to see a continuous fall of 3.5, or 9%, taking CAPE to 37.2. After that, typically, the market pauses, or there might be a small recovery, before the correction often continues, gradually finding its way back to the mean.
There are many ways CAPE can correct. The two main options are: first, earnings pick up while prices hold; and, second, prices fall while earnings stay put. If the bubble bursts then it is the second of those. That would look like an initial 9% fall in the S&P500 (about half of that occurred yesterday, November 5, though time will tell if there is a bounce back or if the correction holds or continues), followed by a pause or possibly a modest rebound, followed by a further fall of a little less than 9%, with that process continuing with smaller falls each time, with a lower probability as the ratio approaches its mean.
We believe that we are in a bubble. Fathom’s current effort is assessing when and how that bubble might burst. Duration analysis is one part of that effort: our Global Outlook, Winter 2026 will assess many others. Events are moving fast: at the time of writing, markets had clawed back about a quarter of the losses sustained in Thursday’s trading, suggesting many investors are buying the dip. Which, of course, does not imply that there cannot be another dip. We will keep you apprised of anything that causes us to change our view along the way.
Register your interest for a free opportunity to hear insights from Fathom’s latest Global Outlook, an independent assessment of the global economy and the risks shaping markets and geopolitics.
Further reading
AI: what kind of bubble is it?