A sideways look at economics
The view from my office window has recently seen the addition of another crane. This latest arrival is now the fifth that occupies my view of the Leeds skyline. Exciting, right? Don’t worry, I can promise you I don’t like cranes enough to write a whole blog on them. But stay with me, as they did get me thinking…
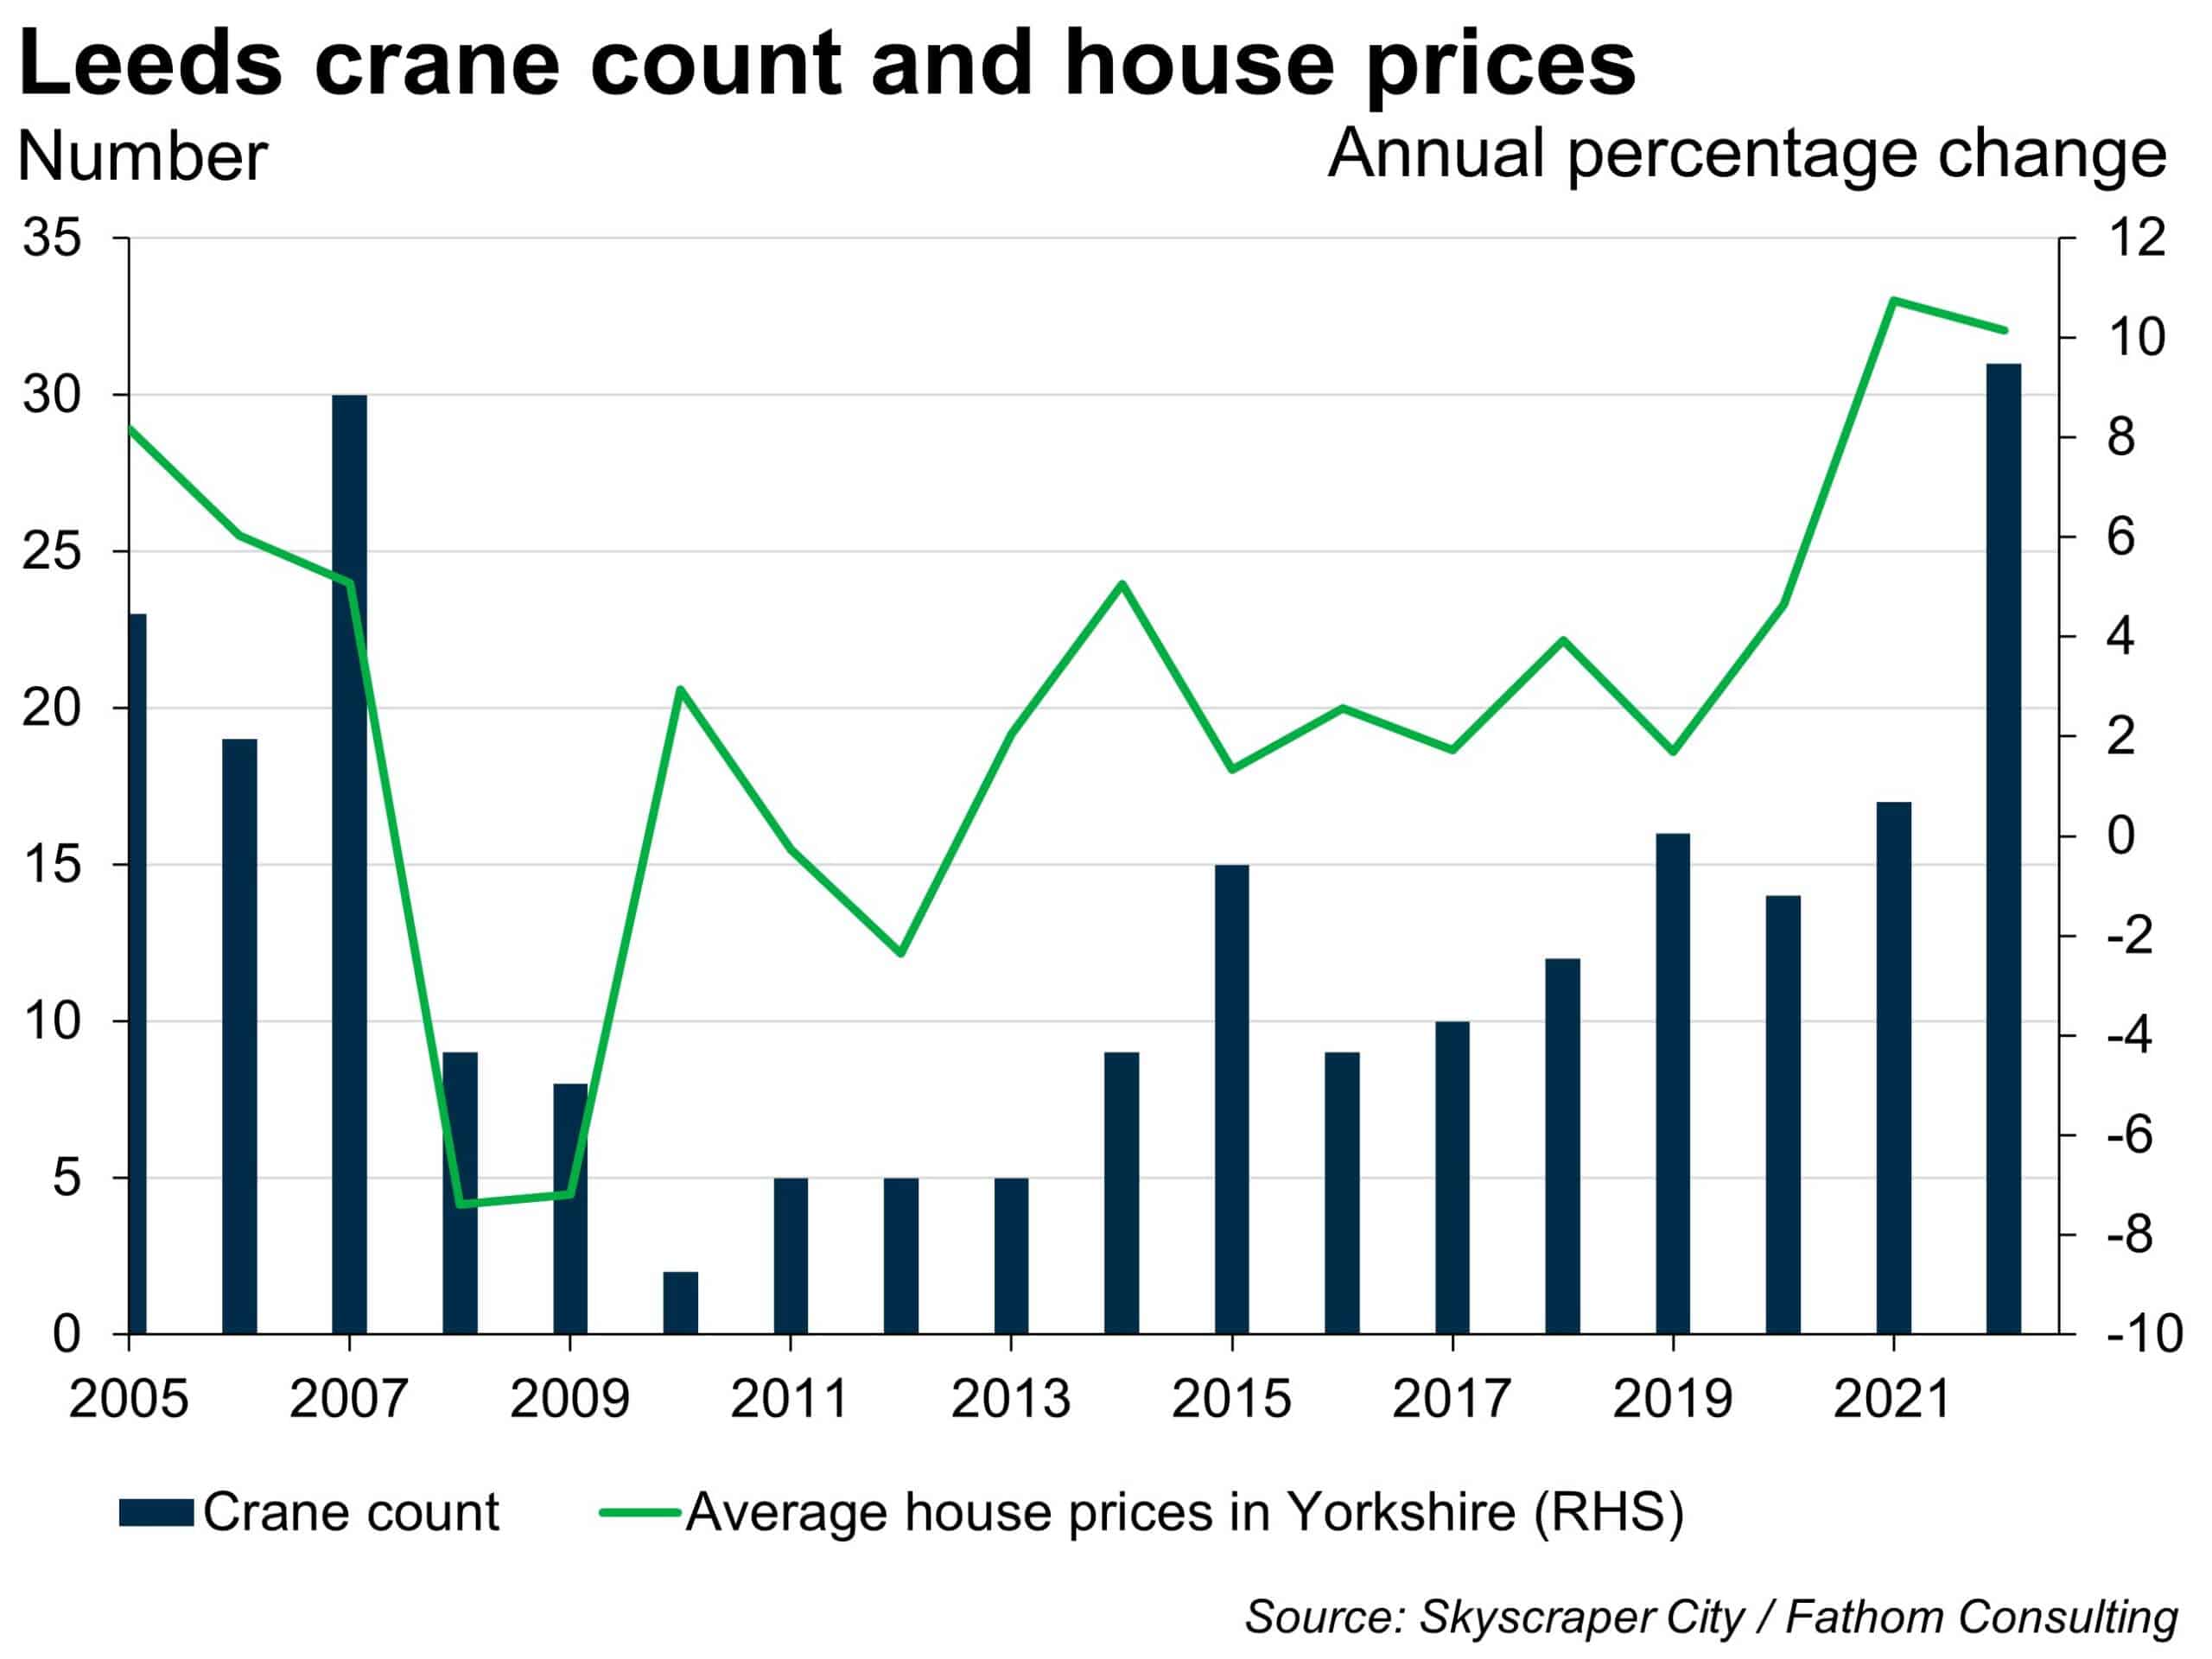
I recall a few years ago hearing from fellow Fathom staff that counting the cranes on a city’s skyline can give a useful insight into the trajectory of economic activity. At its core it’s as simple as equating more cranes with more growth and activity. But more cranes are also a sign that investors have confidence, in both their own situation and the region where they are investing. Delving deeper, you can gain valuable insights into a city’s labour market by tracking the number of cranes working on residential projects; and even use cranes as a way to monitor specific industry performance on a city level, as some firms do.
In fact, based on the crane-count measure, last year Leeds saw its highest economic activity in 15 years, with an exhilarating 31 cranes! Data gathered through the open source Leeds forum on skyscrapercity.com show that the number of cranes gracing the skyline reached levels not seen since the eve of the financial crisis in 2007. I would like to think this is indicative of strong growth in the city, and not an ominous warning. However, with Fathom’s analysis suggesting that — in the absence of any government support — UK house prices are set to fall by around 25% from their peak, it may be the latter. With over 80% of Leeds cranes currently involved in residential projects it could be a depressing year for the city’s crane spotters.
But putting the country’s depressing economic situation to the side, it did make me consider what other quirky ways exist to assess the performance of the economy. Many of these methods use some measure of consumer behaviour as a predictor, methods like ‘the Coffee Cup index’, ‘the Sardine index’ or even ‘the Buttered Popcorn index’ (yep, that actually exists). There were even suggestions during the US recession in 2001 that the length of cigarette butts on the pavements of Wall Street were a good indicator. The shorter they were the more stressed the workforce. These days maybe the number of vape canisters would be a better measure… But for now, let’s look at the ‘Lipstick index’. This was the term coined by Leonard Lauder, former chairman of cosmetics company Estée Lauder, to describe the phenomenon that during tough economic times, sales of lipstick tend to increase. The theory is that consumers are more likely to buy affordable luxury items, such as beauty products, as a substitute for larger indulgences like holidays, during a recession. Evidence for this phenomenon is lacking, but Lauder claimed that between January and September 2008, in the midst of the financial crisis, sales of lipstick rose by 14% in the US — leading some to claim that beauty stocks were close to recession-proof.
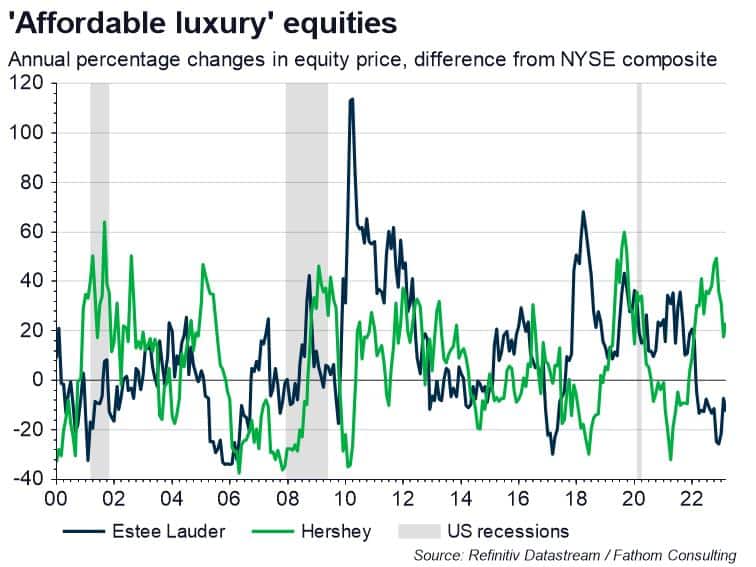
The power of lipstick as a predictor of economic downturns has weakened in recent years, owing largely to the widespread use of face masks, but other small luxuries like chocolate or liquor can be analysed instead. Both of these products saw large increases in demand during the economic uncertainty of the pandemic. It seems this relationship is also reflected to a degree in the stock market. Estée Lauder and Hershey, the largest beauty and chocolate companies respectively in the US by market cap, generally see higher performance in their equity prices during recessions when compared to the NYSE composite.
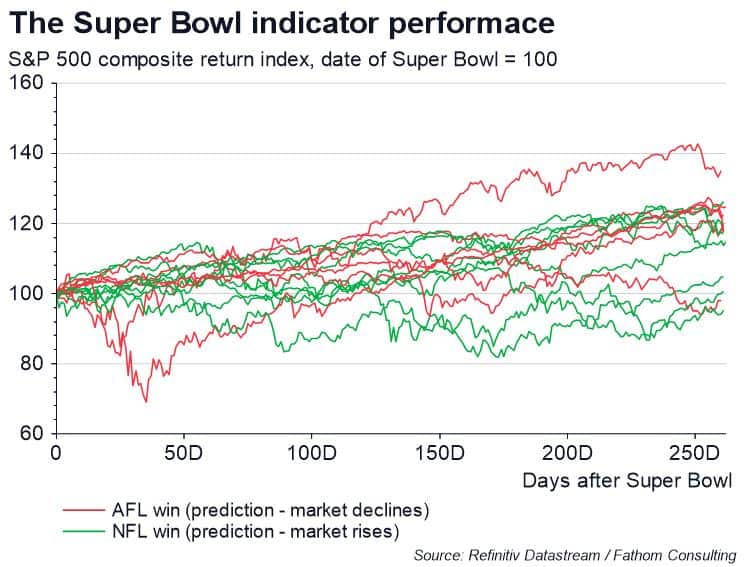
But it’s hard to see the theory as a predictor rather than an observed effect of economic hardship. So is there a better indicator of equity price movements? One that could predict movements over the course of an entire year? Well, the answer could lie in the Super Bowl. In the 1970s, sports journalist Leonard Koppett suggested that the result of the hugely popular sporting event could actually predict the performance of the stock market. The ‘Super Bowl indicator’, as it’s creatively named, predicts that if a team from the original National Football League (NFL) wins then the stock market will go up that year. If a team from the original American Football League (AFL) wins then the stock price will go down. Whilst this doesn’t sound very scientific, at the time it was introduced the indicator had a success rate of 100%. Perhaps not surprising, given that it’s unlikely it would have been invented if it didn’t. Regardless, over the following 40 odd years up to 2015, the indicator maintained a respectable 82% accuracy.
But before you start using this as your next bright investment strategy you may want to know that over the last six years the indicator has only correctly predicted one of the annual movements of the S&P 500… In fact, when looking at the performance of the S&P 500 composite in the year following the Super Bowl, if anything the reverse relationship seems more likely, with original AFL team wins tending to precede a stronger performing S&P than those of the original NFL. Sadly, the Super Bowl indicator is probably best left to locker room chat rather than investment strategies.
Another theory that, at first, also seems best left in the locker room is Alan Greenspan’s interest in men’s underwear. His theory was that sales of men’s underwear tended to decline in the lead up to economic downturns, and vice versa in times of growth. Sadly, several studies have since found little to no significant correlation between male underwear sales and economic performance. But at least we get a bit of insight into the sort of thinking you need to become chair of the Fed.
While these odd indicators may not always be reliable predictors of economic performance, they do offer a unique perspective on the ways in which human behaviour can intersect with economic trends. By looking beyond traditional economic indicators and exploring unexpected correlations, we can gain a better awareness and understanding of the cause-and-effect relationships in the economy — or even just a little amusement. In my case, I suppose I’ve learnt to appreciate the giant cranes that now occupy my view as a sign of confidence in my local area. Let’s just hope, when they eventually come down, they don’t leave behind equally unattractive buildings!
More by this author