A sideways look at economics
Cricket is back on Channel 4. Here’s why I’m not sure that’s a good thing. My suspicion, and I’ll stress I know nothing about broadcasting rights, is that the only reason for its return is that Channel 4’s competitors were reluctant to open their chequebooks. Even the most ardent of fans knows that Test match cricket has a PR problem. In a world where email has superseded the letter and Instagram has replaced the postcard, it’s not hard to see why. I mean, it takes five days to complete just one match — really? That’s why the one-day international, typically lasting a mere eight hours, was born. Eight hours too long? Try watching a T20 (around 3 hours long), or even the ECB’s new ten over ‘Hundred’ competition.
But, just as cricket fans are becoming more impatient, so too is society; and we economists aren’t immune to this. Take, for instance, GDP — the most commonly cited economic indicator. It took Simon Kuznets a year to produce his initial report measuring the size of the US economy. It’s fair to say it was a hit. Scroll forward 87 years and most advanced economies churn out these numbers on a quarterly basis. In 2018, the UK joined the select group of countries producing monthly GDP numbers.
There is of course a trade-off here — the higher the frequency, the greater the volatility. The risk, if you look too closely at high-frequency data prints, is that you miss the bigger picture. One ball doesn’t win a game of cricket and, in a similar way, one monthly GDP contraction rarely spells the start of a crisis. It’s the classic case of not seeing the wood for the trees. Understanding the business cycle, much like watching Test cricket, is all about the ebbs and flows and spotting the key turning points. That’s what gets Fathomites out of bed in the morning, and why we (and others) were initially sceptical about ONS’s monthly GDP release.
Even so, the profession was (kind of) happy with that status quo for a while. But, with the events of last year, the demand for timelier updates became greater. Weekly, and even daily, numbers were now ‘needed’.[1] ‘High-frequency’ was the phrase on everyone’s lips. Fortunately, along came the Oxford COVID-19 Government Response Tracker which monitored the evolution of lockdown measures, the biggest single driver of economic outcomes. Better still were the Google and Apple mobility data that followed, since these also incorporated the behavioural responses in countries like Sweden where state-imposed restrictions were more limited.
But, there’s one problem with all of these high-frequency indicators — they’re not GDP.
All of these indicators are great but what do we do with them? Either directly or indirectly, we try to map them on to GDP. Why? Well, despite its shortcomings (of which there are many), we all know what GDP is. That’s to say, we all know what a ‘normal’ GDP print looks like and what it means for the labour markets, inflation, public finances etc.[2] The same can’t be said for mobility data. There’s no history to compare to. What does a 50% fall in mobility mean, except for more time to watch cricket?
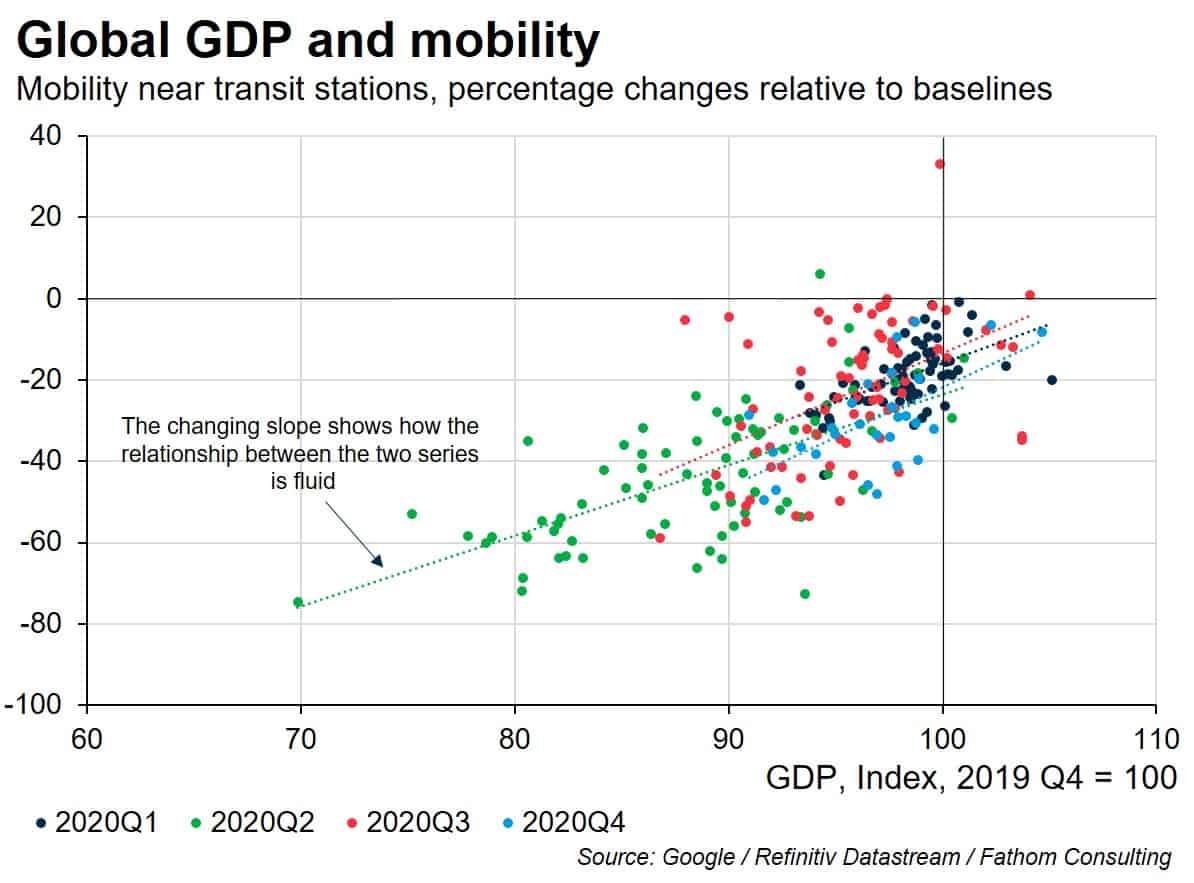
We can map mobility into GDP numbers — it’s fairly straightforward to do. The problem is that the relationship between the two is fluid, as the economy undergoes substantial changes with the move towards remote working. For instance, writing this week’s blog did not require me to leave the house (a near-100% fall in my mobility). More importantly, neither did any of this week’s meetings. And yet, somehow, my output was unchanged. Of course, we can re-estimate the relationship between the two concepts with each round of quarterly GDP prints but that creates a ‘nowcast’ rather than a ‘forecast’.
So, what does that mean for mobility? Can the economy recover before mobility does? Will it ever go back to what it was before? In time, we may be able to augment the mobility data to take account of the structural changes ahead of time. However, until we do, mobility (like one day cricket) is at best a pale imitation of the thing we’re really interested in: GDP (and Test cricket). Moreover, it’s the story of the business cycle, much like the Edgbaston Test of 2005 and the Headingly Test of 2019, that will be remembered for many years to come.
[1] See, for instance, the weekly economic indicators of the New York Fed, Bundesbank and OECD.
[2] Of course, GDP (or at least the per capita variant) is often cited as a metric of national wellbeing. There are many who would criticise its usefulness for this purpose, and they would be right to. Kuznets himself said “the welfare of a nation can scarcely be inferred from a measure of national income.” In other words, the quality of growth also matters. However, the problem remains that there is no measure so widely available and with so long a history as GDP. Until that problem is resolved, GDP’s innings as a measure of a nation’s standard of living is likely to go on.