A sideways look at economics
When I was ten years old, my dream was to become an archaeologist. I grew out of it when I realised that mud, dust, and dirt are not my comfort zones. Though sad to realise that I would never discover the next hidden treasure myself, I found solace in learning about discoveries of ancient sites through the arguably more dirt-free platform of books, magazines, and documentaries. During a recent ‘hunt’ for the next intriguing read, I came across research studying the nature of ancient economies, whose themes (including inflation) still give headaches to economists. I was thrilled to find that my favourite historical figure, Alexander the Great (it had to be as I grew up 20 miles from where he was born), had much to do with the first example of inflation. I was also surprised, probably negatively, to find that some of the mechanics of today’s inflation resemble those of the inflation in Babylon 2400 years ago. History repeats itself, or rather, we strive to repeat the same mistakes.

Alexander the Great may have been an all-time great military genius and conqueror, but he was also responsible for the first (recorded) inflation. It lasted a decade, and for the average Babylonian, it halved the value of the shekel (around 8.5 grams of silver) in his pouch. Putting too much money into circulation — or what today would be called excess liquidity provided by loose monetary policy — was the probable explanation for the spiralling inflation, according to researchers who analysed archaeological data from Babylon. Hang on a minute; there are data? Can I have a go with them? It seems I can, so I did…
The field of ancient economics suffers from a lack of time-series quantifiable data. Luckily, there is one exception: late Achaemenid and Hellenistic Babylon. Babylon’s main temple employed scribes to record the city’s business. They noted on clay tablets how much barley, dates, mustard, cress, sesame, and wool one shekel of silver would buy. The tablets also record astronomical observations, allowing researchers to place them in time precisely. This is the most detailed dataset of the ancient world, which is on a par with modern datasets. More importantly to anyone who enjoys uncovering patterns and statistical associations, this dataset has been transferred to a spreadsheet which is available online.[1]
With an Indiana Jones attitude that is fitting to the virtual age we are experiencing, I downloaded the dataset and studied the non-missing data from unique dates between 384 and 60 BCE (there may be more than one observation per year, but they come at irregular intervals). Barley constituted the main diet of the Babylonians, while wool was the main textile source and export product, according to the International Institute of Social History. Therefore, I plotted the prices of barley and wool in the two charts below.
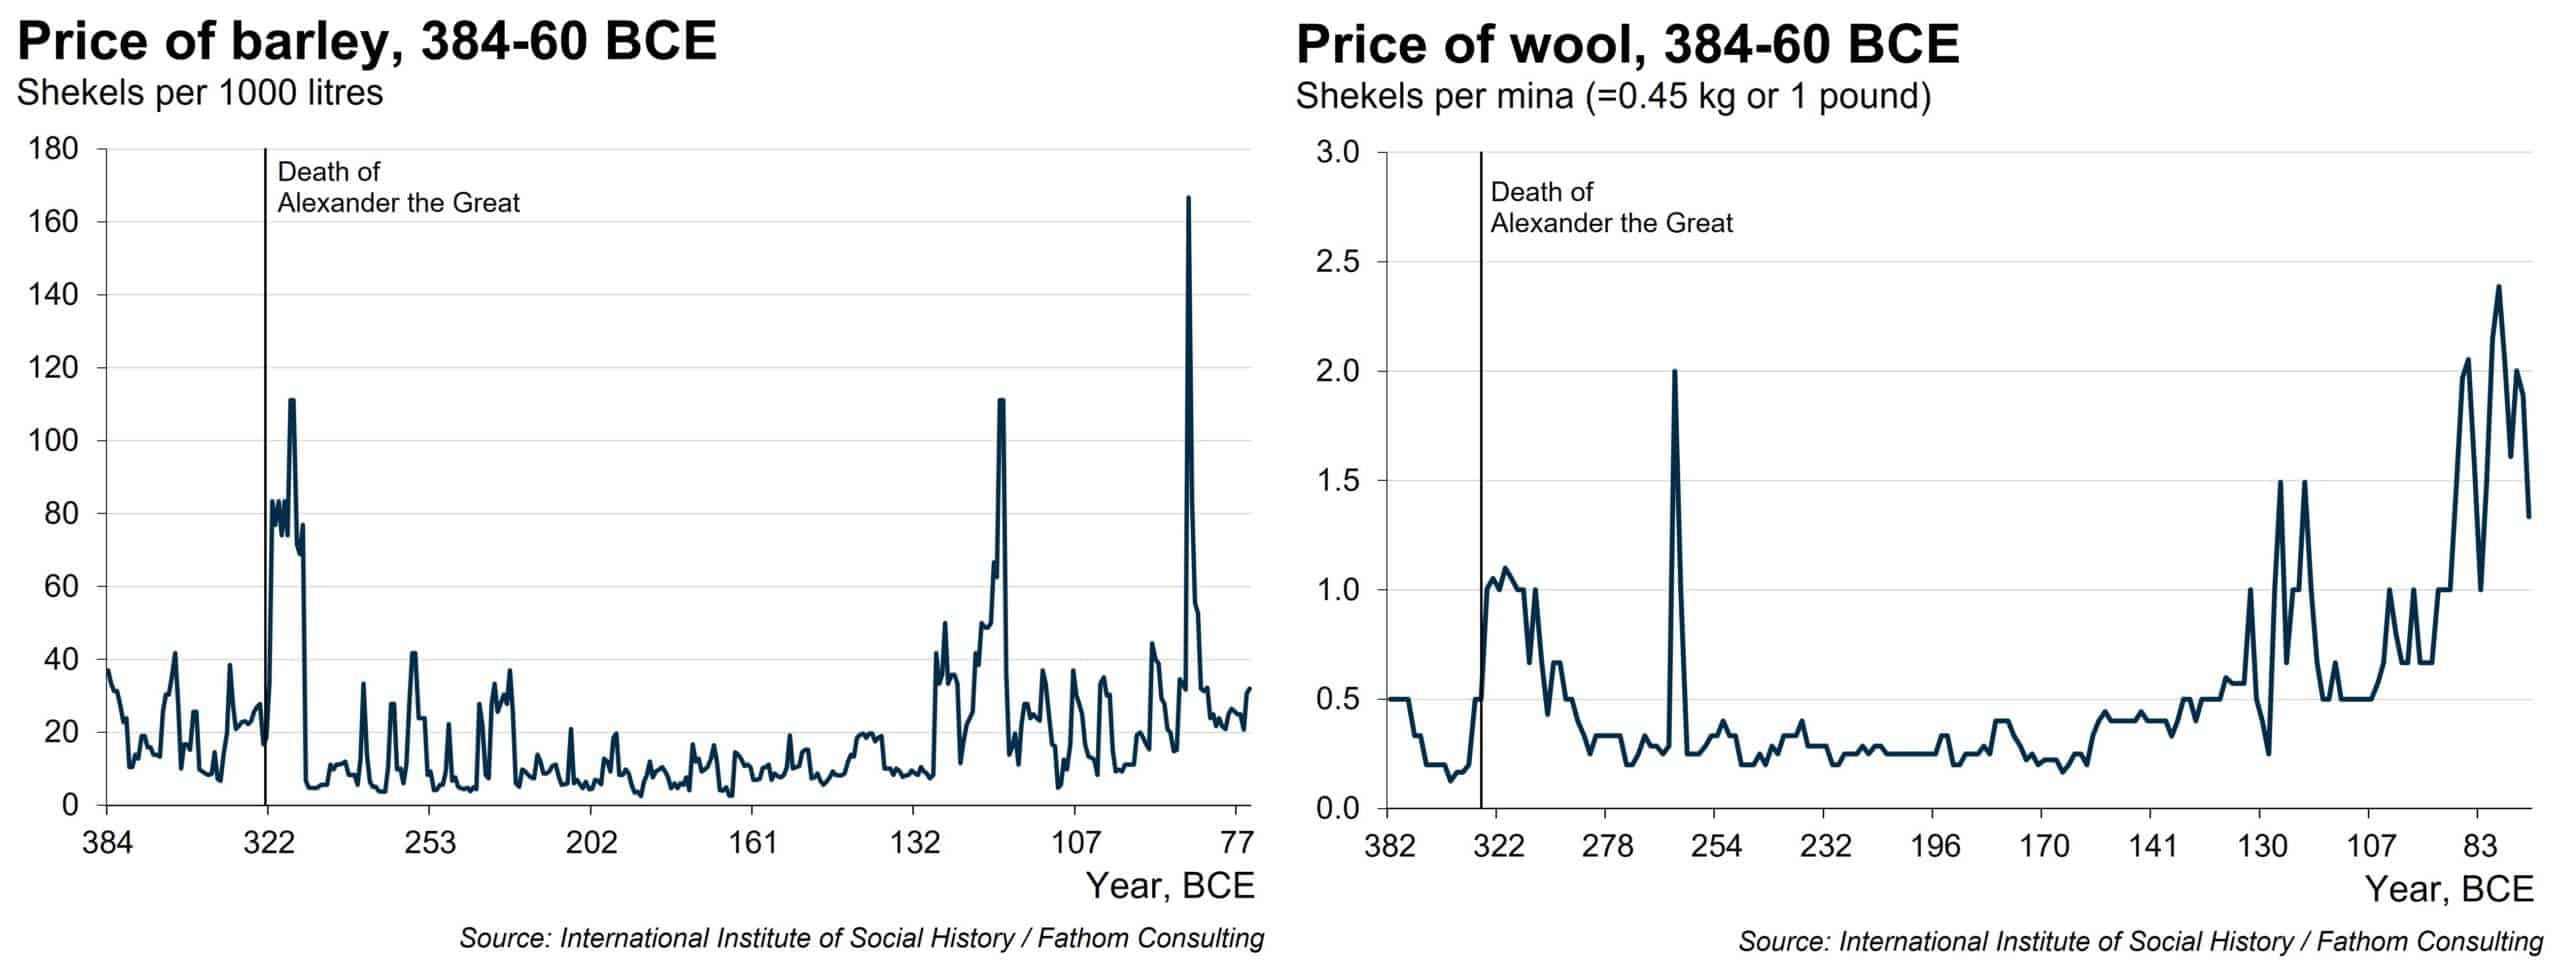
Looking at the figures, it becomes clear that immediately after Alexander’s death in 323BC, inflation kicked in, massively depreciating[2] the value of the Babylonian shekel. Peter Temin, who first noticed the above patterns, highlights that this is the first documented prolonged inflation.[3] Prices returned to the norm before destabilising again after 141BC, when the Parthians attacked, initiating a period of conflict and rising inflation.
However, a visual depiction may be misleading or provide few insights for how the inflation story was linked to Alexander’s death. Influenced by accounting research aiming to tell observers what happened to earnings-per-share ratios after the Sarbanes-Oxley act was enacted in 2002 (I think reading the ancient Babylonian tablets is more thrilling), I employed descriptive regressions of each commodity over time. Specifically, I modelled the relationship between each commodity’s log price and the year, year squared, year cubed,[4] and three dummy variables for different intervals:
LogPricei = α + β1Year + β2Year2 + β3Year3 + β4Dummy1 + β5Dummy2 + β6Dummy3 + ε
The dependant variable is commodity i’s shekel per 1000 litres (or mina for wool). The first dummy variable, Dummy1, controls for years from 322 BCE to 313 BCE, isolating the effect the death of Alexander had on prices.[5] To allow for possible longer commodity price disruption, the model includes two dummy variables (Dummy2 and Dummy3) which control for ten-year windows from 312 BCE to 303 BCE and from 302 BCE to 293 BCE.[6] These variables would show the extent to which prices continued to be abnormally higher ten and twenty years after the initial ten-year shock.
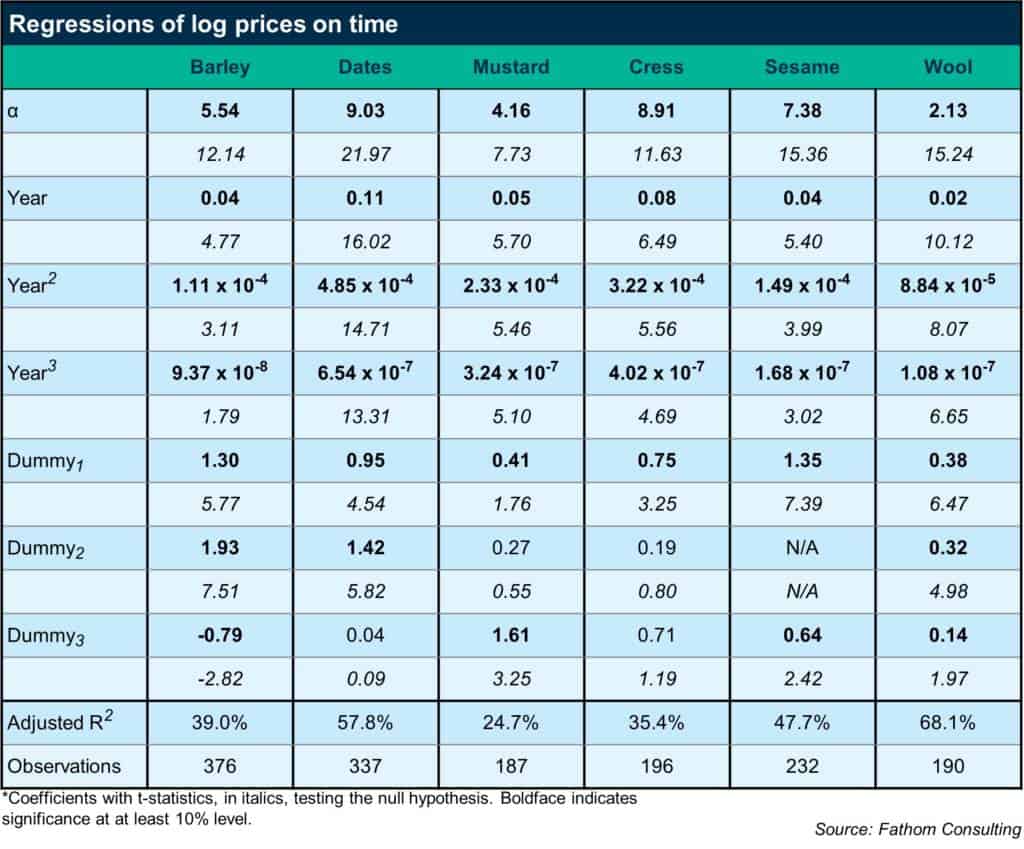
The results of estimating the above model for each of the six commodities are shown above. All of the time variables are significantly greater than zero, indicating that the cubic equation is approximating the time-series price curvature adequately. The dummy variables for the ten-year window immediately after Alexander’s death are all positive, large, and statistically significant. Most of the coefficients on Dummy2 and Dummy3 are also positive and significantly different from zero. Collectively, the table suggests that Alexander the Great’s death inflicted higher commodity prices on Babylon and it took about 30 years — a generation — for them to return to a normal trend.
But what was fuelling that inflation? That appears to be the combined effects of the large amount of silver circulating, Alexander’s unexpected death and the dynastic conflicts that followed, according to experts. Booty brought back by Alexander from his conquests, mostly silver, was readily available — especially since Alexander had already founded a mint in Babylon — to fund any expensive undertaking. Professor Temin suggests that in the wake of Alexander’s death the generals used his ‘treasury’ to fund armies, flooding the market with silver and causing inflation. They wanted more soldiers, carpenters etc., and they were willing to pay more than the going rate. When these craftsmen went out to buy barley, and they were told there wasn’t any, they would be able to offer more money. In time-honoured tradition, the trader would find that he did have barley to sell after all.[7]
Can we draw some parallels with today? I think we can. If anything, the analysis shows that the acts of decision-makers always have sharp repercussions for ordinary people. The political uncertainty surrounding Alexander’s death, and the large amount of money in circulation aimed at ‘blowing up’ supply bottlenecks triggered higher prices in a way that reminds me of the way current governments are trying to deal with post-pandemic issues, such as the lack of truck drivers, an unwillingness to return to work and shortage of carbon dioxide for commercial freezing. The quivers felt in ancient Babylon after Alexander’s death can teach lessons, but will these lessons ever be learned by decision-makers? I am inclined to believe that the future decision-makers will always think that through skill or luck his/her/their actions or inactions will trigger less unfavourable results than in the past.
[1]Archaeologist Robert van der Spek of the Free University of Amsterdam digitised the dataset.
[2]The average value of the skekel for all six commodities approximately halved for the first ten years post-323BC.
[3]Temin, P. (2002), ‘Price behavior in ancient Babylon’, Explorations in Economic History, 39, pp. 46-60.
[4]The year-squared and year-cubed variables allow the price path to curve over time. Any polynomial approximates an arbitrary path of prices over time, but the third-order polynomial is a reasonable choice which is also employed by the related studies of Slotsky (1997) and Temin (2002).
[5]The length of the windows to account for any price disruptions post Alexander’s death are arbitrary. However, the exact windows have been used in a similar analysis by Temin (2002).
[6]There are no sesame price records to define , hence the missing coefficient on the table.
[7]There is weak evidence on extensive supply issues since trade was facilitated by Alexander’s conquests even after his death, while destruction of crops was not widespread, according to archaeologist Robert van der Spek.