

A sideways look at economics
In Joseph Heller’s Catch-22, frustrated with the inability of the airmen under his charge to execute a perfect 90-degree turn on parade, Lieutenant Scheisskopf gives serious consideration to having nickel-alloy swivels surgically inserted into their thighs. Likewise, all governments probably sometimes wish the individuals and private firms in their jurisdiction would line up perfectly in the service of the needs of the state, forgetting that, in open societies, the state exists primarily to serve them, not the other way around. When looking at the behaviour of firms in open societies, you are seeing the invisible hand of the market doing its thing. In China, though, on some measures, it’s much closer to the Catch-22 scenario. When looking at the behaviour of Chinese firms, up to and including how they innovate, you are often seeing the hand of the state.
Corporate zombies are companies whose profits before interest payments do not cover their interest payments. The proportion of the US corporate sector that is made up of zombies has been rising (ignoring the COVID-related spike) since 2018 and reached 27% in 2023. That’s not far off the peak that proportion hit during the global financial crisis of 2008/09. But the higher interest rate environment of the recent period has slain some of those US zombies, and the proportion is down slightly in 2024. In China, however, zombies are on the rise and, in 2024, hit a peak higher than ever before experienced, having increased in proportion more than fourfold since 2017. China has now overtaken the US on this measure for only the third time since we started collecting these data in 1998. And the rate of increase is troubling, to say the least. Is mass zombie slaying imminent?
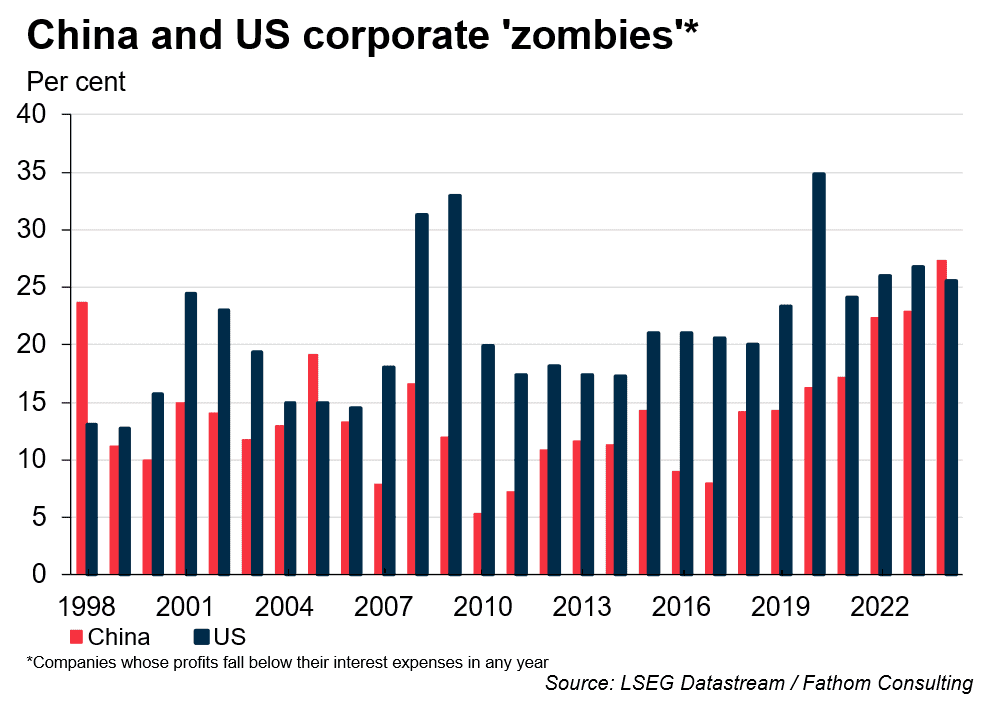
Probably not. Zombies in the US are not in the same game as zombies in China. In the US, when interest rates rise (and, with them, the cost of borrowing for the corporate sector) it’s game over for the zombies, as recent experience has demonstrated. US rates have risen and so have corporate failures; the degree of zombification of the US corporate sector has started to reduce. The zombies are being slain.
Not so in China. There, loss-making firms are supported, sometimes for many years, probably by a mix of state subsidy, forbearance on bank loans and other measures (though the data are very opaque). There is a parallel here with the fiscal position of the Chinese provinces, which are permanently in a deep, structural deficit, and therefore permanently reliant on transfers from the centre. That dependency creates control. In a similar way, being a zombie company in China might not rule out your survival as a firm even in a world where the prevailing, non-subsidised cost of borrowing rose sharply. If you are doing something that the state wants you to do (and for exactly as long as that is true), there’s a good chance the state will make sure you stay in business.
Previous Fathom research has developed that story in detail. Here, I want to describe and explain one of our more difficult charts in this framing, which is related to this story. The chart below shows how innovation is related to profitability in different countries.
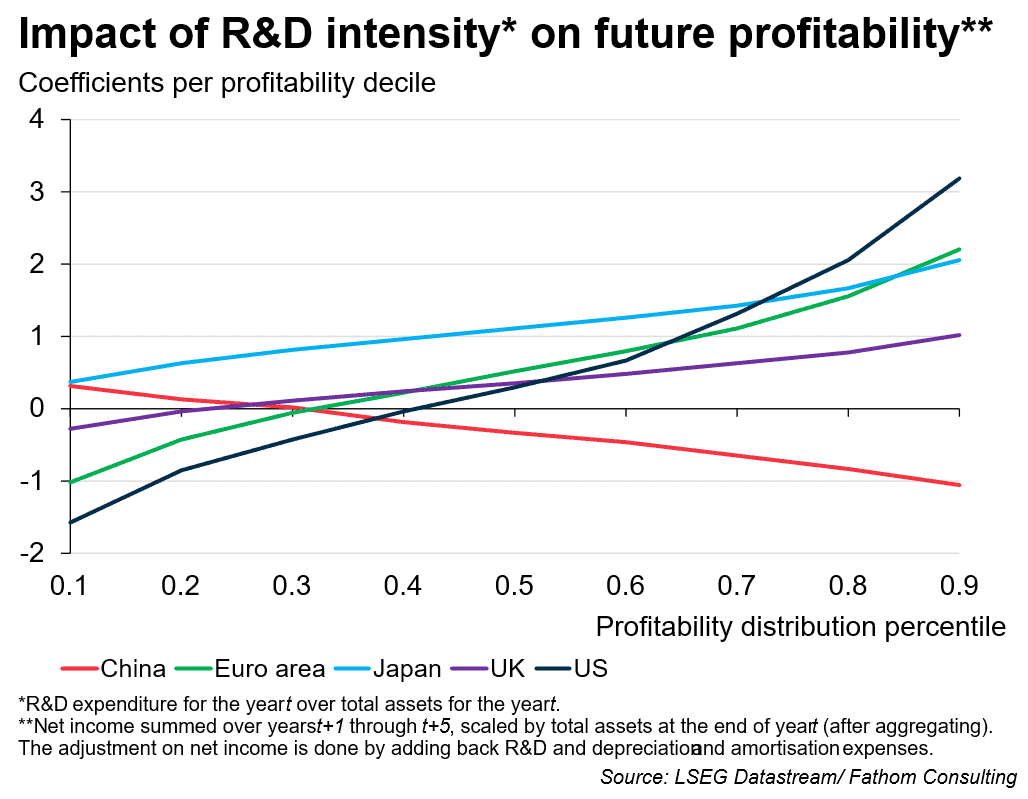
The vertical axis in this chart shows the value of a coefficient (a beta) that captures the relationship between R&D intensity (which is expenditure on R&D expressed as a share of gross value added) and future profits. A higher beta implies that more intensive use of R&D is associated with higher future profitability.
The horizontal axis is the distribution of profitability, measured as the share of profits in gross value added. The further to the right you are, the more profitable you are.
For most countries, and especially for the US, the line in this chart is upward sloping, and increasingly so as you get out to the right, the profitable end of the spectrum. When unprofitable firms do R&D, it tends to be associated with even lower profitability in expectation; and when profitable firms do R&D it tends to be associated with even higher profits in expectation.
The way to read that regularity is as follows: unprofitable firms can make deeper losses, and for a longer period, when that reflects expenditure on R&D. The market will tolerate those losses. Why? Because innovation provides a route for an unprofitable firm to get to the big profits in the high deciles in due course. Many of these unprofitable innovators will fail; but some will succeed, and the structure of the market permits the attempt and rewards the success. This pattern reflects the proper functioning of a market economy that captures and understands the value of innovation. Unprofitable firms can still spend on R&D, because that’s how some of them will turn into profitable firms in the long run.
All the market economies pictured in the chart above exhibit an upward slope in their line: some are steeper, others shallower: some are higher, others lower. But they all slope upwards.
The exception is China, where the line slopes down.
For the least profitable firms in China, there is essentially no relationship between R&D and future profitability. For the most profitable firms, the relationship is negative. This is a profoundly non-market result. It suggests that the patterns of innovation in China are not primarily driven by the market, but by something else. That something is, at least in part, the state. If you make profits, the state expects you to innovate in its interests, not in your own. If you don’t make profits, there is no way out of that scenario through innovation. The Chinese state needs big players to undertake the kind of R&D that the state judges to be in its own interests.
It’s not that Chinese firms don’t innovate; they do. It’s that the relationship between innovation and profitability suggests that it’s not really the market that is driving that innovation; it’s the state, and nothing but the state. The state achieves this outcome by distorting incentives. For example, China’s “super-deduction” for R&D, introduced in 2008, has been progressively expanded and now allows firms to deduct up to 200% of qualifying R&D costs from taxable income. The current regime, made permanent from January 2023, materially lowers the effective cost of sustaining R&D programmes and can support continued investment no matter what is the expected pay-off to the innovating firm. The net effect is lots of (possibly over-reported) ‘qualifying’ (i.e. state-approved) R&D, which actually diminishes the future profitability of the firms undertaking it, though it presumably increases their current profits after tax breaks.
The market for innovation has been instrumentalised in the service of the state. Some of these companies might be zombies, sure. But they’re zombies who can march in a straight line and execute a perfect 90-degree turn on command.
Lieutenant Scheisskopf would have been proud.
Much of the discussion of ‘industrial strategy’, ‘reindustrialisation’ and ‘economic statecraft’ in the US and elsewhere is geared towards making market economies imitate China to some degree, by structuring the incentives of private firms so that their behaviour conforms more closely to the socially optimal pattern. Expect the US line in the chart above to flatten to some degree if those strategies succeed. And expect US growth to slow, probably (though not certainly). That trade-off is not problematic, in my opinion, in a democracy, where the people ultimately get to choose the balance between state and private incentives.
The data discussed here just scratch the surface. The full picture is complex and subtle, and changing all the time. Some parts of the Chinese corporate structure appear to be as dynamic and market-sensitive as the US, or more so; while others are moribund, chronically loss-making and heavily state-influenced. We are constantly monitoring this changing landscape. You can access our world-leading China analysis through our China Subscription Service. And, if you are interested in hearing more on this subject, please enquire here for a free presentation.
Further reading
Dynamism in China’s corporate sector
The charts and data featured in this blog are available to LSEG clients through Chartbook on Workspace, and to Fathom clients directly through our Client Zone. To learn more about accessing Fathom’s data, models and tools, get in touch with us here.