A sideways look at economics
The ‘infinite monkey theorem’ postulates that, given an infinite amount of time, a lowly monkey will eventually be able to reproduce the complete works of Shakespeare merely by jumping around on a keyboard. Used in this context, the monkey is effectively a metaphor for a machine capable of generating a random sequence of letters and characters. It’s what we might refer to today as a random number generator. This metaphor, sometimes credited to French mathematician Emile Borel writing in 1913, has stood the test of time. It was invoked frequently in frustration by my A-level economics teacher during the late 1980s. Whenever one (or more!) of us scored less than 20% in a multiple-choice paper that had five options, (a) to (e), Mr Robertson would cry out: “But a monkey could do better than that!”. Which brings us neatly on to UK GDP statistics.
In a note to clients last week, we devoted a considerable amount of space to a defence of the ONS and its ability to produce early estimates of UK economic growth. Specifically, we argued that, if we restrict our analysis to the period since 2003 when estimates of constant-price GDP have been produced on a consistent basis, then, contrary to recent assertions by the Bank of England’s Monetary Policy Committee, the preliminary estimate of growth is unbiased. Unbiased it may be, but is it any good? In one important respect, the answer must be ‘No’!
In our note, we used the chart below to illustrate the pro-cyclical nature of revisions to UK GDP growth. When in truth the economy is growing rapidly, the preliminary estimate of growth tends to get revised up. When in truth the economy is growing slowly, or contracting, the preliminary estimate tends to get revised down. But there’s something rather striking about our chart that I hadn’t noticed, and I’m very grateful to a client for pointing it out. Only a single dot lies along the horizontal axis. We‘ve made it red so it’s easy for you to see. What this tells us is that only once over the period 2003 to 2015 has the preliminary estimate of UK economic growth survived, unrevised by the passage of time. [1] It’s worth pausing for a moment to consider quite how remarkable that is.
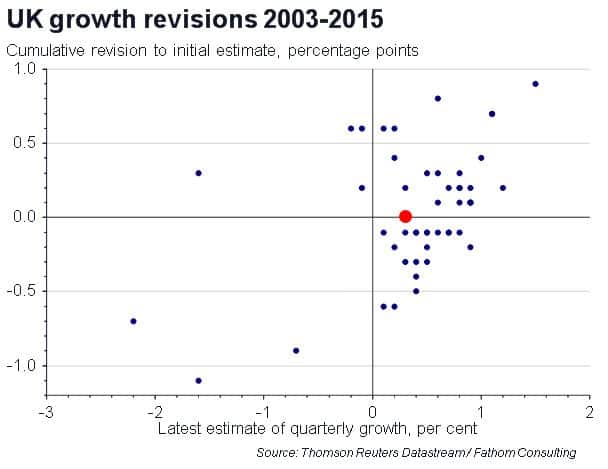
Over the period 2003 Q3 to 2015 Q4, the latest estimate of quarterly GDP growth has fluctuated between -2.2% and +1.5%. By convention, the ONS publishes the preliminary estimate to one decimal place. So, in a sense, it has 38 numbers to choose from. There are 50 quarters between 2003 Q3 and 2015 Q4, which means the ONS has had 50 goes at getting it right. It has managed it just once. As Mr Robertson would have said: “A monkey could do better than that” (though only just, in this case: 50 x [1/38] = roughly 1.3).
But it’s not all doom and gloom. Just because the ONS rarely gets its estimate of economic growth spot on at the first attempt, that doesn’t mean there’s no value in the preliminary estimate. Further analysis suggests that the ONS gets the direction of change of economic growth right on the first attempt almost 70% of the time. Which means that the UK economy is slowing. Probably. Have a great weekend!
[1] Even here we’re using a little poetic license, as it was only unrevised in a net sense. The red dot represents 2015 Q1. The preliminary estimate of growth in that quarter was 0.3%, the same as today’s estimate. But the preliminary estimate was revised up to 0.4% in June 2015, then to 0.5% some months later, before being pushed back to 0.3% in June 2016 where it has sat ever since.