

A sideways look at economics
On yet another scorching London morning Jane wakes up to the tinkling tunes of Berlioz on her DAB radio, designed in the UK, made in China. Unwilling to face the day quite yet, she burrows down into blue and white-striped sheets, purchased at IKEA, made in China. The temptation of an ice cold cup of green tea, grown and packaged in China, coaxes her out of bed and she pads out to the kitchen in bright pink UGG slippers and white cotton pyjamas which are both, as you might have guessed, made in China. She stirs the tea with a steel spoon, made in China, and flips on a made-in-China fan. The iPhone she reads her news on, that’s made in China, and she’s considering buying an electric car: designed, assembled and made in China.
You see where I’m going with this, I’m sure. And, of course, there’s nothing new or groundbreaking about me telling you that China dominates global manufacturing and goods exports. Even if you had been living under a rock for the past couple of decades this fact is unlikely to have escaped you. Indeed, if you looked under the bottom corner of your rock home you’d probably find it stamped with ‘Made in China’ as well.
China has steadily grown its trade dominance in the years since 2001 when it joined the World Trade Organisation (WTO), seeing its global market share of goods rise from just over six per cent in 2002 to more than 15 per cent in 2024. Some of this growth is due to China producing more valuable or expensive goods now than it did 20 years ago. Fathom has extensively researched China’s steady ascent up the production value-chain, building a whole bespoke trade dataset that we’ve named RiCArdo.[1]
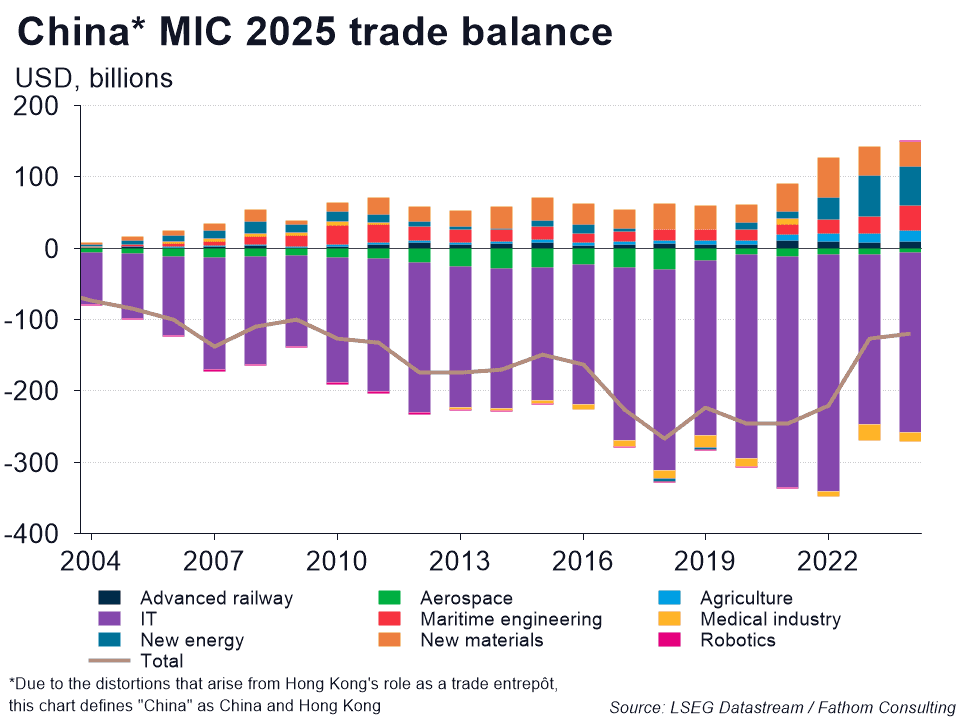
We can use RiCArdo for a multitude of questions, such as assessing China’s success in its ‘Made in China’ plan. This plan, which was launched in 2015, sought to upgrade China’s manufacturing from production focused on the cheap, low-tech goods segment to goods in the high-value, high-tech category. Nine focus sectors were selected: advanced railway, aerospace, agriculture, IT, maritime engineering, medical industry, new energy, new materials and robotics; and, as we can see from the chart below, China had largely achieved its ‘MIC’ goal of market dominance by the time the plan concluded last year, albeit not quite securing its supply chains.
China’s swift advance up the value chain is hugely impressive, but to a degree it was to be expected, as countries do tend to shift into higher-value goods production as they get richer. Take a typical country at lower income: it starts off producing low-tech/low-value goods, selling these goods and re-investing part of the profits in capital of both the physical and human type. Productivity goes up and so do wages. The country starts making more advanced goods, but it also stops making some of the cheapest goods, as higher wages mean labour costs are too high to justify that production.
This is a highly stylised example, of course, and in reality the route isn’t so smooth, but it gets at the idea of comparative advantage, a concept originally defined by 19th century economist David Ricardo (for whom our trade dataset is named). In simple terms, the theory goes that countries specialise in goods they are comparatively better at producing, owing to things like natural resource endowment, internal cost structure or specific expertise, and then trade these goods with other countries that produce different goods. According to this theory, it’s the ability to specialise (and trade what you’re comparatively better at in exchange for what another country is comparatively better at) that delivers the best outcomes. That’s why economists have traditionally favoured free (or at least free-ish) trade.
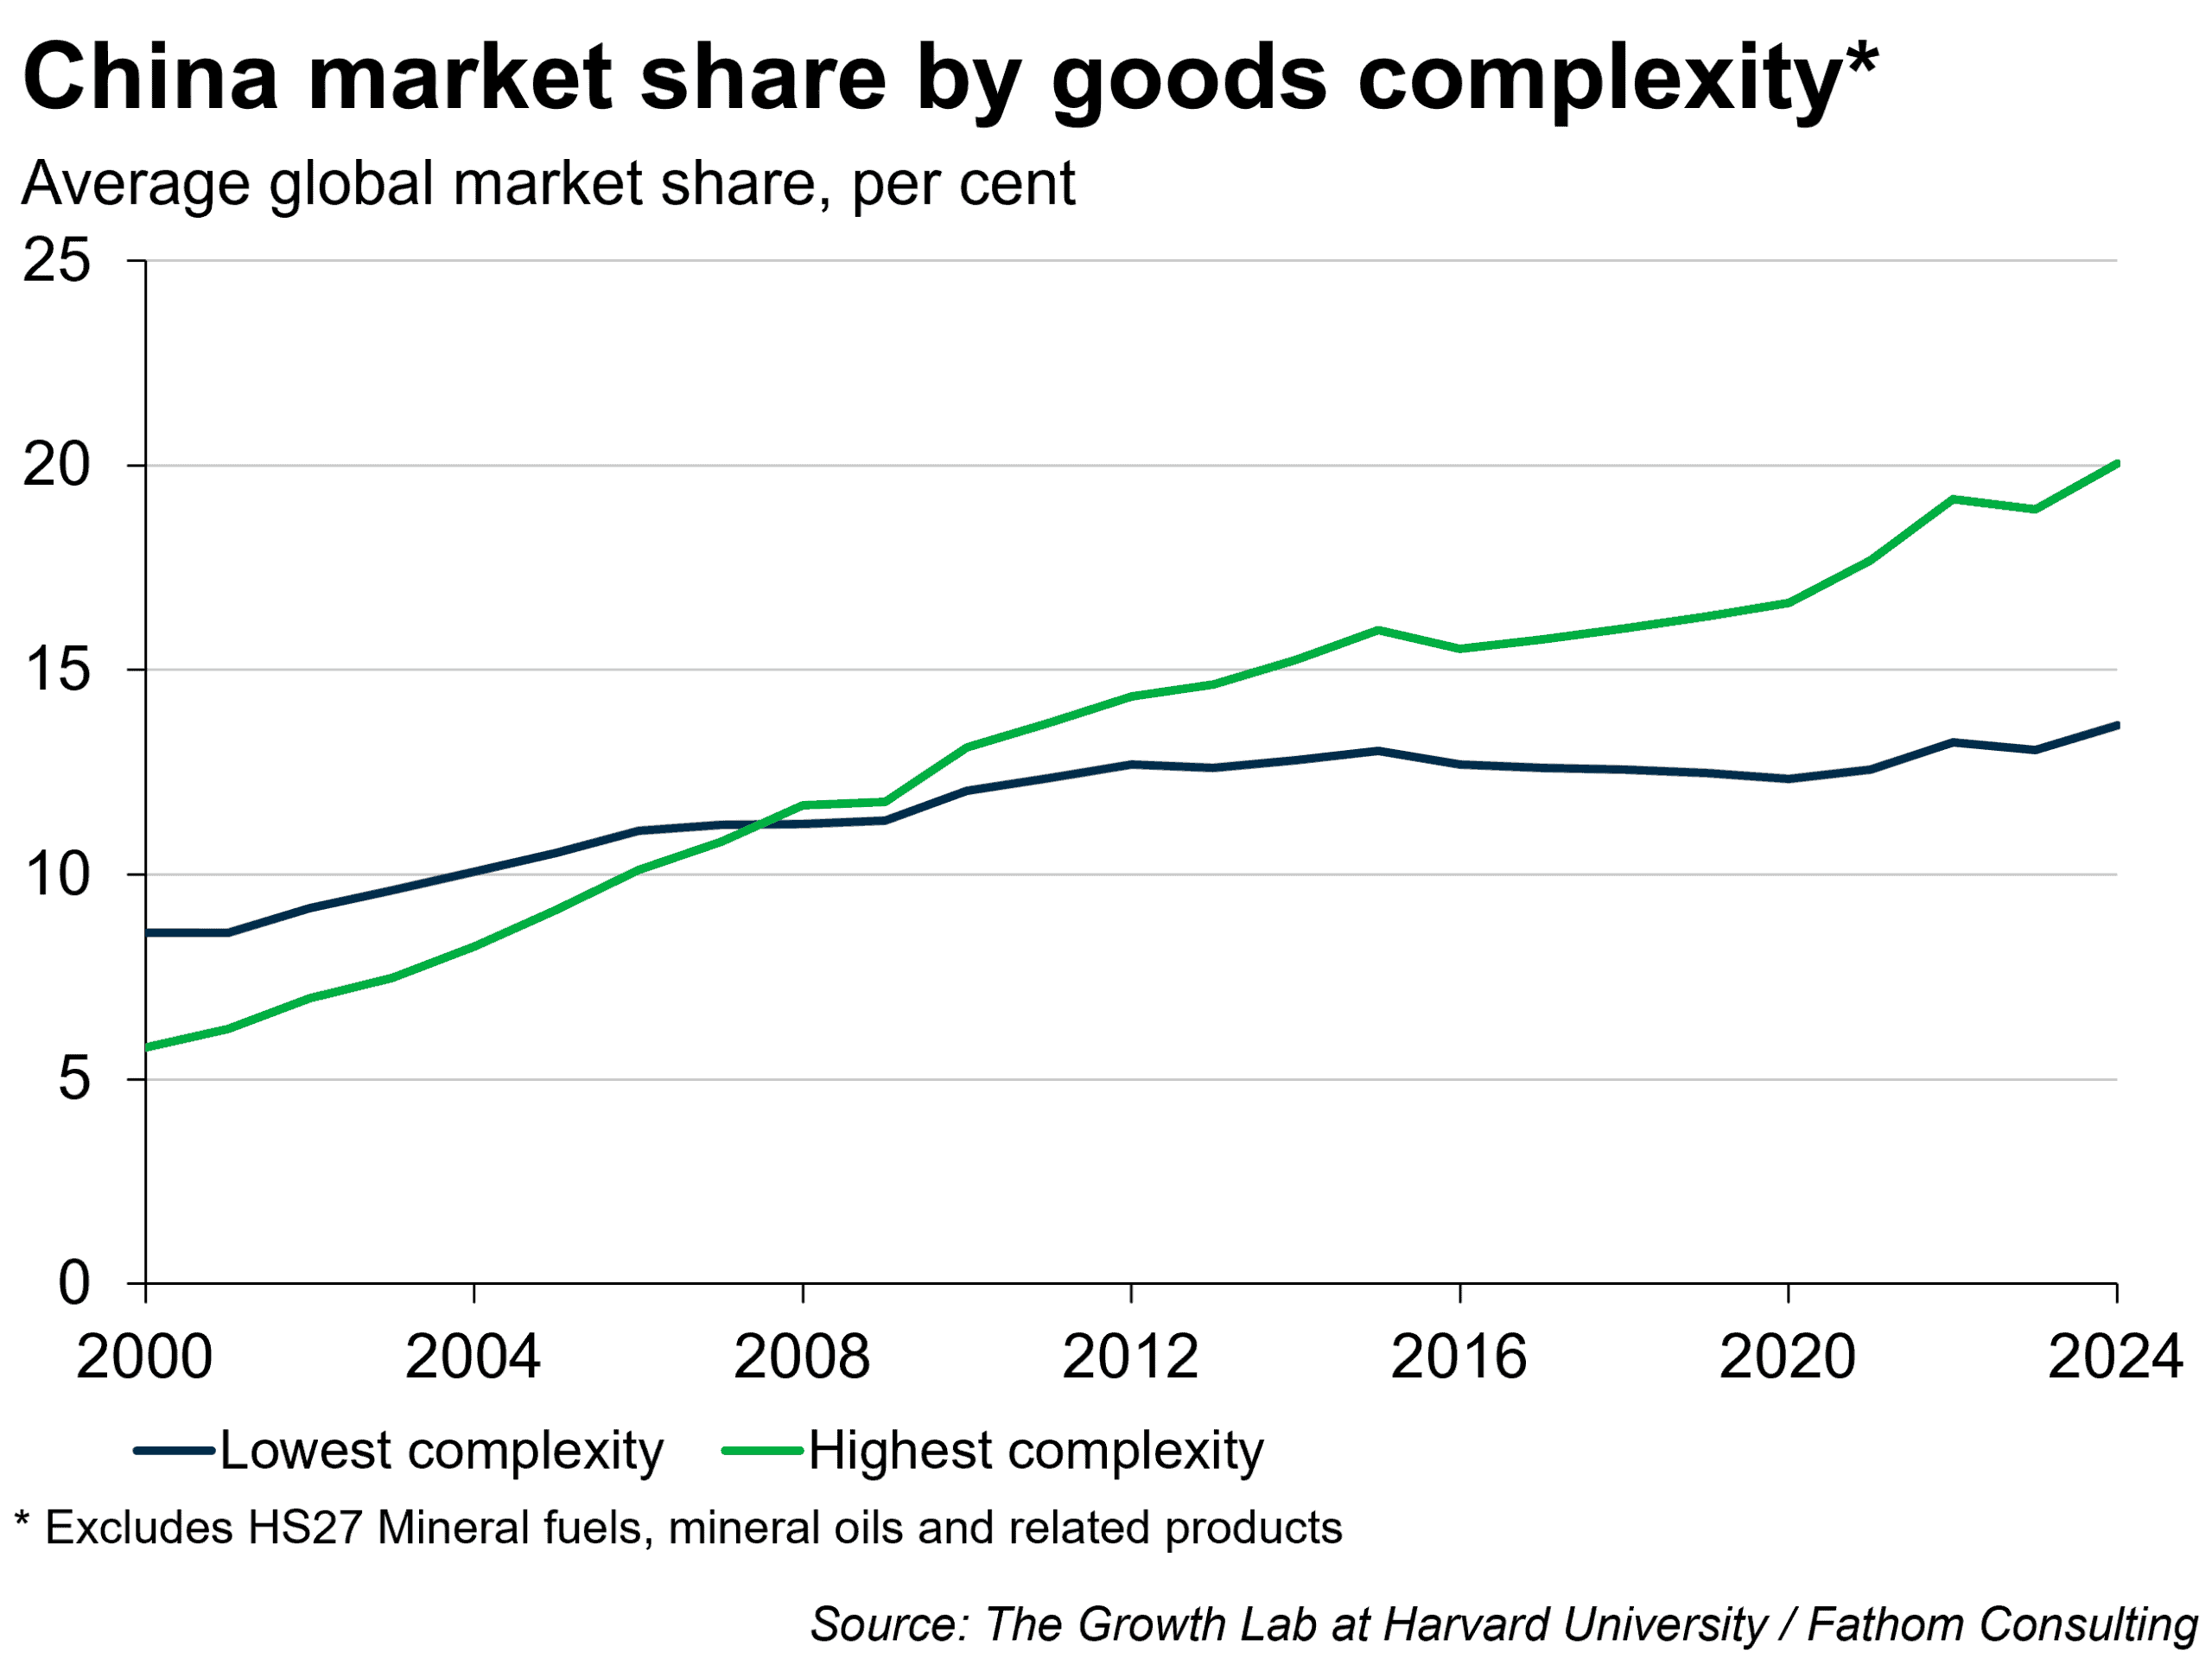
In China’s case, as the country grew richer, deepened its capital stock and increased educational attainment, its comparative advantage would naturally have been expected to shift away from producing less complex goods and towards the more complex ones, thus importing from other countries the goods it itself had stopped producing. However, as the story of Jane’s Made-in-China morning illustrates, this has not happened. While China is growing its market share of high-complexity goods, it has not given up market share in low-complexity products, as the chart below shows.
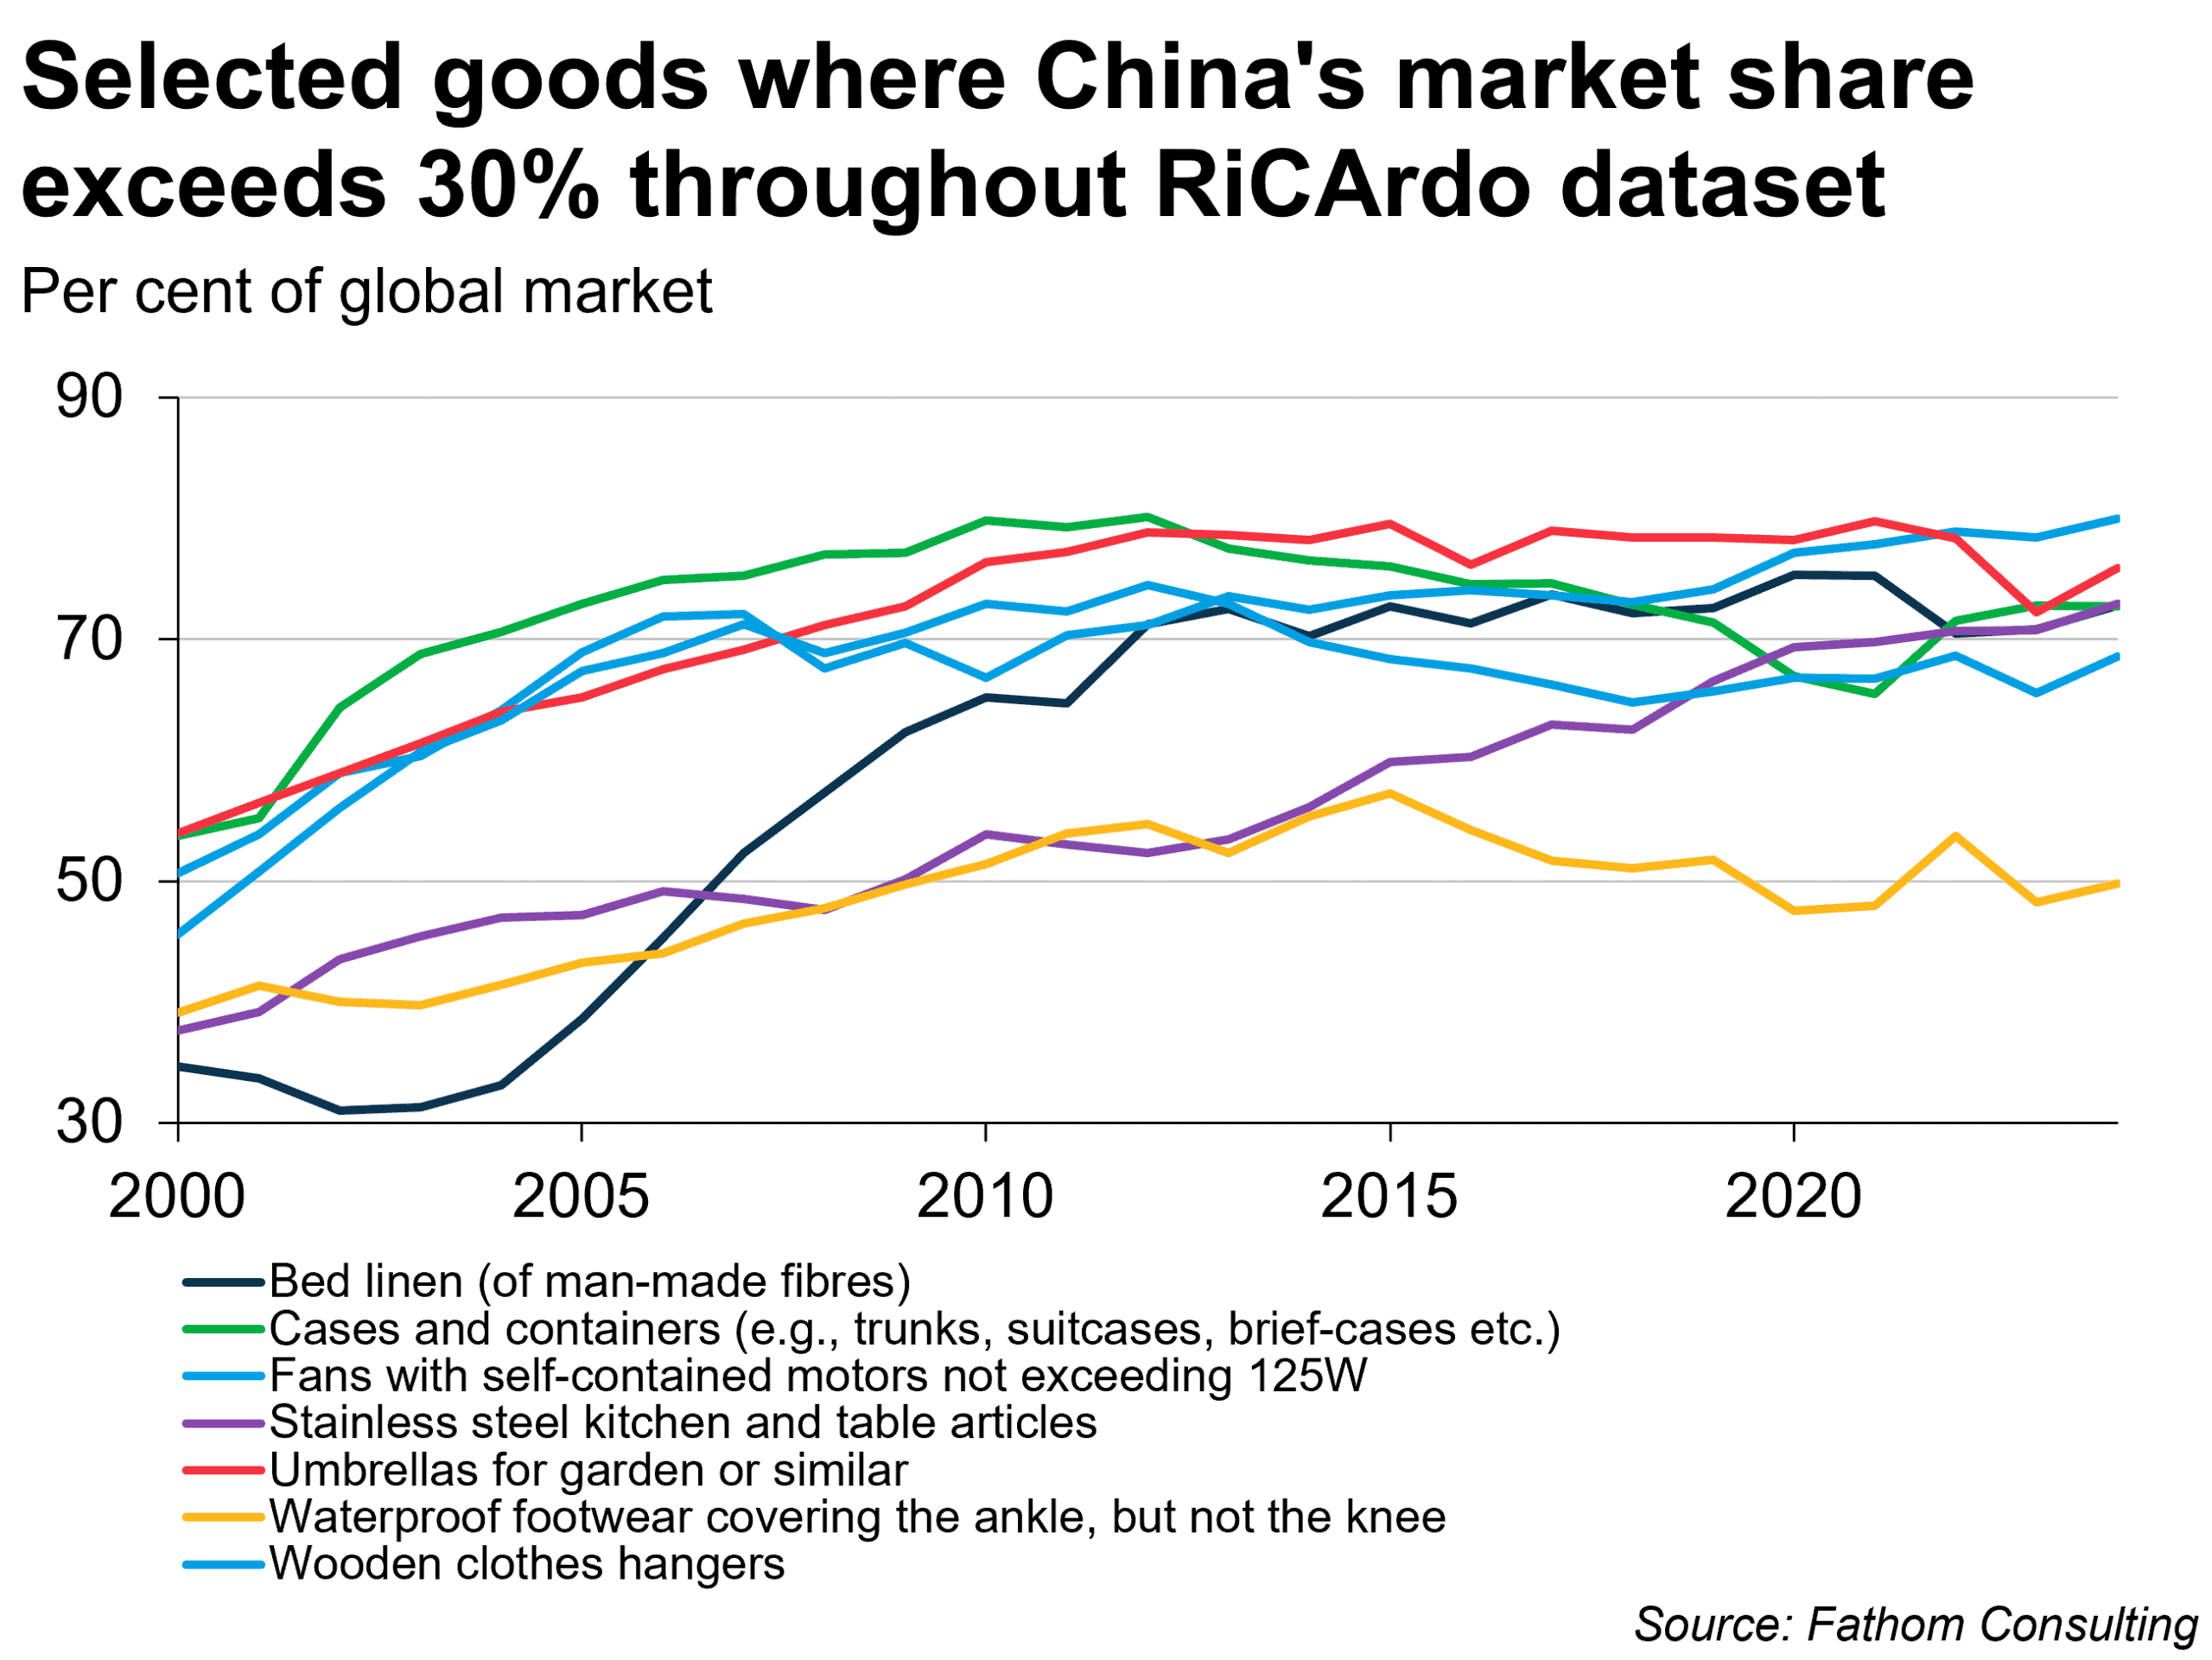
To demonstrate this in a different way, let’s go to the start of the RiCArdo dataset in 2000: of the more than 6000 product codes the dataset covers, China had a market share exceeding 30 per cent in 383 of them. Green tea (a Chinese export for more than 1000 years) is on that list, but so too are other products we associate with the China shock 1.0,[2] such as lighters, Christmas decorations or Jane’s pyjamas. Fast forwarding to 2024, we see China has maintained above 30% global market share in 177 of these 383 goods, even increasing its share in 145 of them. So, while China exported 58% of the world’s smartphones in 2024 and is producing an increasing share of the hardware that goes into advanced electronics, it is also producing 46% of the world’s inflatable balls, up from 31% in 2000, and 86% of the plastic combs, up from 54%.
China’s growing manufacturing prowess has caused consternation over the past decade in both the US and increasingly in Europe, in part because of the national security concerns raised by relying on China for critical goods and technologies. The 2019 clampdown on Chinese telecom producer Huawei and its products, for example, was motivated by fears that China could use the equipment for surveillance, as well as suspicions regarding corporate espionage and sanctions violations.
Increasingly, concerns also relate to Chinese companies outcompeting the advanced domestic industries of the US and Europe, owing to unfair subsidy regimes (if you’re asking the Americans or Europeans), or skill and hard work (if you ask the Chinese). Then there’s the issue that China sells ‘everything’, but buys very little by comparison, in part because it produces most things itself, and in part because its rise to production behemoth has come at a heavy cost not just to production in other countries, but also to its own consumers, with bloth labour compensation and welfare spending sacrificed at the altar of industrial progress.
Finally, while the stories that may dominate the headlines in advanced economies concern largely our own grievances with China’s global trade capture, other countries poorer than China also have reasons to gripe, as by holding on to legacy industries through wage suppression and now increasingly through automation ‒ essentially seeking absolute advantage in as many sectors as possible, rather than specialising in its comparative advantages ‒ China makes it harder for other countries to follow in its industrial footsteps.
Further reading
China’s industrial policies, a help or hindrance?
What does it mean ‘to win’ for the US and China?
[1] Fathom’s RiCArdo database tracks bilateral goods trade between close to 200 economies, over 25 years, and across more than 6000 product codes. Deploying mirror statistics and methods to adjust for value discrepancies between trade flows it systematically remedies inconsistencies in trade reporting. Building up from the HS6 product level Fathom has created several iterations of the dataset allowing us to track trade across custom-made sectors such as Made in China goods, agricultural products or other high-tech goods.
[2] The China shock 1.0 relates to losses in manufacturing employment in a number of economies purportedly due to China’s entry onto global markets in the early 2000s, driven by firms in advanced economies shifting production to China where labour costs were much cheaper, as well as by the rise of Chinese domestic producers. While China soaked up much of the manufacturing that moved abroad, for many of the sectors and industries affected by the China shock there was already considerable import competition, and it is therefore likely that production would have been offshored regardless. Clearly loath to waste a catchy expression, the authors who originally coined the term ‘China shock’ have since popularised the concept of ‘China shock 2.0’, which relates to China’s rising competitiveness in more advanced sectors, including EVs and green tech.