A sideways look at economics
Tribes form and then ossify over time, but they aren’t stable forever. There are two forces in play: the tendency for individuals to associate with and feel loyalty towards one tribe; and the tendency to desire something different. Desire, according to the psychoanalyst Jacques Lacan, is the desire of the Other.1 The tension between those two forces, loyalty and betrayal, is the dynamic source of evolution in human society, explored in ancient literature like the Iliad through to Romeo and Juliet and up to the Godfather and endless similar stories.
It’s not just in human society where these ‘tribes’, thought of as fluctuating patches of relative density, are found: it’s in the very fabric of the universe. The famous and intriguing map of cosmic microwave background radiation reveals a fluid pattern of varying intensity right back at the dawn of time — a ‘structure’ that has persisted ever since.

A similar structure is evident at the level of individual identity too. We tend to assume that each of us maintains an identity that’s in some way constant over time, and distinct from others. But, in fact, each of us is a linked chain of closely related identities evolving over time2 — often having more in common with other individuals than with our own past selves.
Each of us is part of a tribe, or more than one, and in a sense each of us is a tribe in our own right.
In economics, one method for analysing the structure and evolution of such tribes is ‘clustering analysis’. Applications can range from ferociously complex systems such as banking networks, to relatively simple problems like how to set up a seating plan.
Fathom has just returned from its annual office Awayday (a phrase to freeze the blood if ever there was one). After a day sitting around a table discussing corporate strategy, in the evening we took over a small restaurant equipped with two long tables laid out in parallel.
How to seat everybody?
In our office, as in every other, there’s a constantly evolving set of associations among the employees, with a ‘structure’ that’s clearly visible but extremely difficult to map or to predict, because it’s fluid. Some elements of that structure are determined by the necessities of managing the workflow: teams that work together tend, to a degree, to socialise together too. And then there are other, elective affinities that don’t conform to those patterns – we might call them ‘water-cooler groups’. Finally, there are groups that flow from positions within the hierarchy of the company — loosely, partners, senior economists, economists and students.
Our aim in devising a seating plan was to break up the ‘tribes’ that exist in the company, and to distribute people evenly across the two tables. This is a problem with many dimensions. To start with, we needed to identify the ‘tribes’, or clusters, so we could break them up.
That’s not a trivial task. Different approaches to clustering analysis will yield different results. It’s a curiosity in clustering analysis that many of the different approaches have been given women’s names: for example, there are DIANA (Divisive Analysis) and AGNES (Agglomerative Nesting), both of which approach a tree of associations between individuals, but with one (DIANA) starting from the bottom and the other (AGNES) starting from the top. Then there are PAM (Partitioning Around Medoids), and her big sister CLARA (Clustering Large Applications), both of which (along with ‘K-means’, a name that has yet to rank above 100 in the popular girls’ names charts, to my knowledge) start by counting the number of clusters and then assessing which individual fits into which cluster.
Choose your name; choose your set of clusters — it’s unlikely that any two approaches will agree completely.
With the seating plan, we went for an approach that’s most akin to PAM — choose the number and composition of clusters by eyeballing the ‘data set’ (the characteristics of Fathom employees) across the three dimensions above. There are techniques available that allow such ‘eyeballing’ to be done formally, using real data across as many dimensions as required. The picture below is an illustrative representation of Fathom’s problem using one such technique — to preserve anonymity, we’ve identified the individuals according to their beverage of choice.3
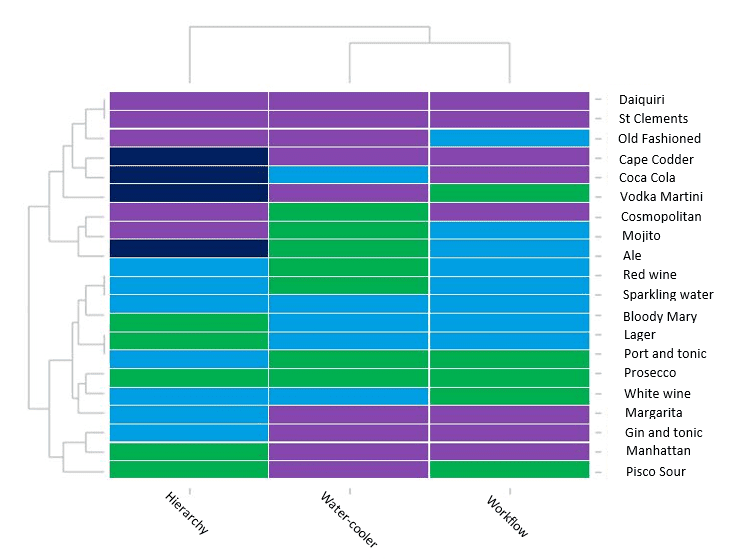
The way to read the diagram above is as follows. Similarly coloured cells in each column indicate membership of groups in that dimension. The individuals (named by their drink preferences) are listed on the right. The dimensions — hierarchy, water cooler and workflow — are ‘clustered’ according to the tree at the top, with ‘water cooler’ and ‘workflow’ more closely associated with each other than with ‘hierarchy’. Then the clusters of individuals are mapped into the tree shown on the left. The user has to pick how far up or down that tree to go. We chose to stop at four clusters of individuals — i.e. two steps into that tree structure starting from the left.
The first two clusters correspond, largely, to the senior people in the company, but with water cooler and workflow similarities taken into account too — so not all the purples in the hierarchy column are in the same cluster, nor all the dark blues. And so on.
Having identified the four clusters, the next problem was how to arrange them across two tables of ten people per table. There were other constraints too — such as an old-fashioned adherence to alternating gender where possible around the tables (slightly hampered by the fact that there are fewer women than men in Fathom).
The end result was almost completely determined by the constraints: there was almost no other way of arranging people that simultaneously met all the constraints that we had imposed.
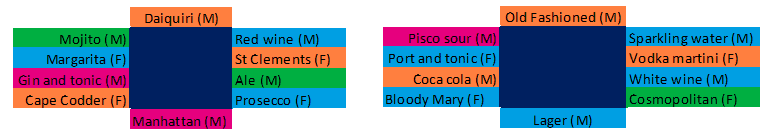
In the end, of course, it didn’t matter. The food was delicious and the drink plentiful. That’s usually enough to ensure that the conversation flows among Fathom employees, no matter where people are sitting. For the readers’ information, this is how the four clusters — orange, green, blue and pink — can be distributed across the two tables.4
Many readers might argue that the approach set out above is unnecessarily complex, and that most normal people would sit down and chat about it for a while and then come up with an ad hoc solution every bit as good. I’m not saying you’re wrong. It’s just that we enjoy this kind of thing.
1. This famous phrase — characteristically — yields many possible interpretations. One is: the grass appears greener on the other side — what you don’t have always seems more desirable than what you do have. Alternatively: what other people appear to desire is what I desire: there’s a queue outside that door so whatever’s inside must be good. Whichever of these we prefer, it implies that there’s a strong psychological pull away from what we know and towards what we don’t know, which is the opposing force to the gravitational pull of family and tribe.
2. The work of the late Derek Parfitt develops this line of thought far more eloquently and with far greater attention to the state of the literature than I can in this note.
3. Of course there’s ‘clustering’ across drink preferences too — perhaps this naming convention could be thought of as an aspect of personal identity. Incidentally, that’s how it was treated by PG Wodehouse in his glorious Mulliner stories.
4. There are formal techniques for solving this kind of distributional problem too, which aim to maximise the minimum distance between individuals from the same group, or similar algorithms, not employed here.