A sideways look at economics
I’ve been called many names in my lifetime. As a child, my parents called me “Andrew”. At school, a bit more variation was introduced. Sometimes, I was “Andy”. Slightly shorter, made sense. Occasionally, I was referred to as “Harris” (my surname) — there was another Andy/Andrew so it helped to avoid confusion. A few of my peers even referred to me as “Charlton” after the football team I support. Weird, but they’re a great team so I really should’ve been flattered. But then Fathom entered my life and I was given the label of “Andrew Harris”. Why both names? No idea… Of course, I share my first name with our chief economist, but he’s always been “Mr B” so there was never any risk of confusion. There’s also Andrea, Fathom’s Technical Director. Ok, that could be confusing but ‘full naming’ me started before he joined and, in any case, he often goes by “Zazza” and, on occasion, “MegaZazza”.
None of this should be taken as a complaint — I really don’t care what people call me. Rather, it has just provided me with a meandering way to introduce the real topic of this TFiF, the famous British spy who is also referred to by his full name. That is of course Bond, James Bond…
Love it or loathe it, we all know the format of a Bond movie — fast cars, gadgets and a catchy theme tune, coupled with plenty of action and a carbon footprint likely to shock Fathom’s climate economics team. But, what can we say about it from an economic perspective?
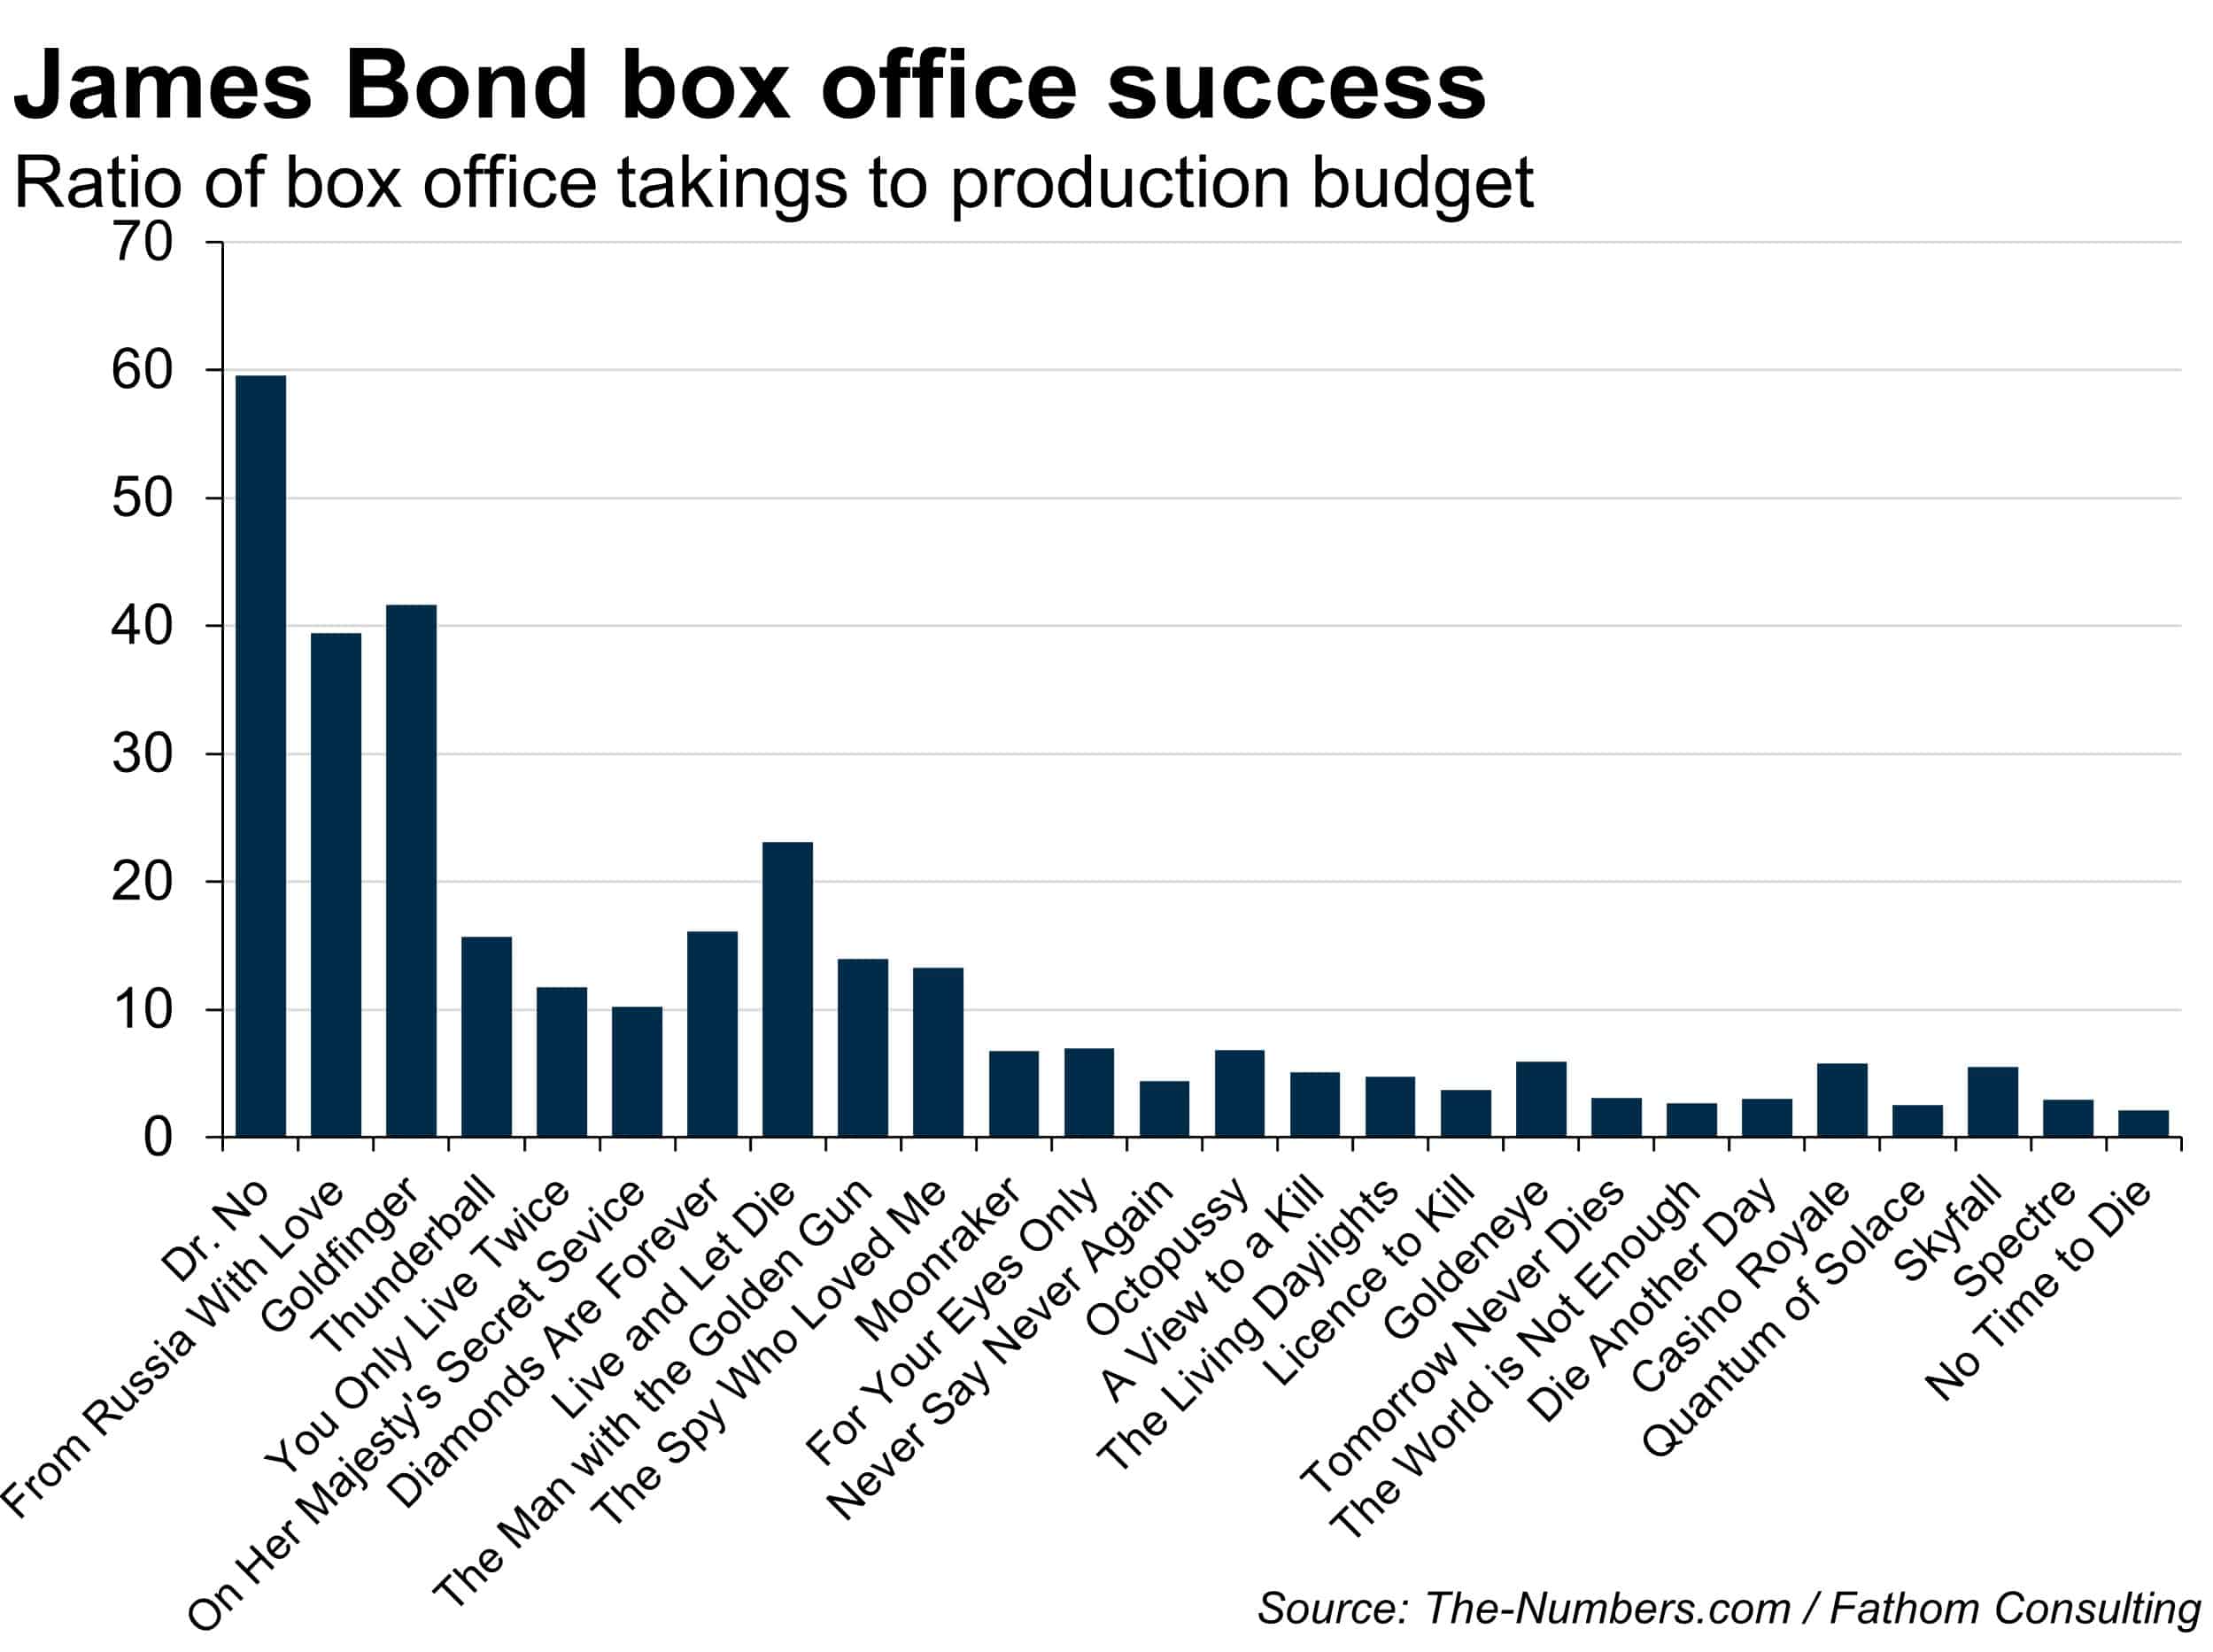
Let’s start at a micro level. The bar chart below shows the ratio of box office takings to costs for each film, dating back to 1962’s Dr. No. As you can see, this has dramatically fallen over time. Oh dear — does this suggest the franchise is a sinking ship? I’m no expert, but it seems unlikely that MGM (the studio behind the franchise) would allow this to happen. More likely is that there’s been a structural change in the way the industry operates and, perhaps, one or two accounting tricks are also being utilised.
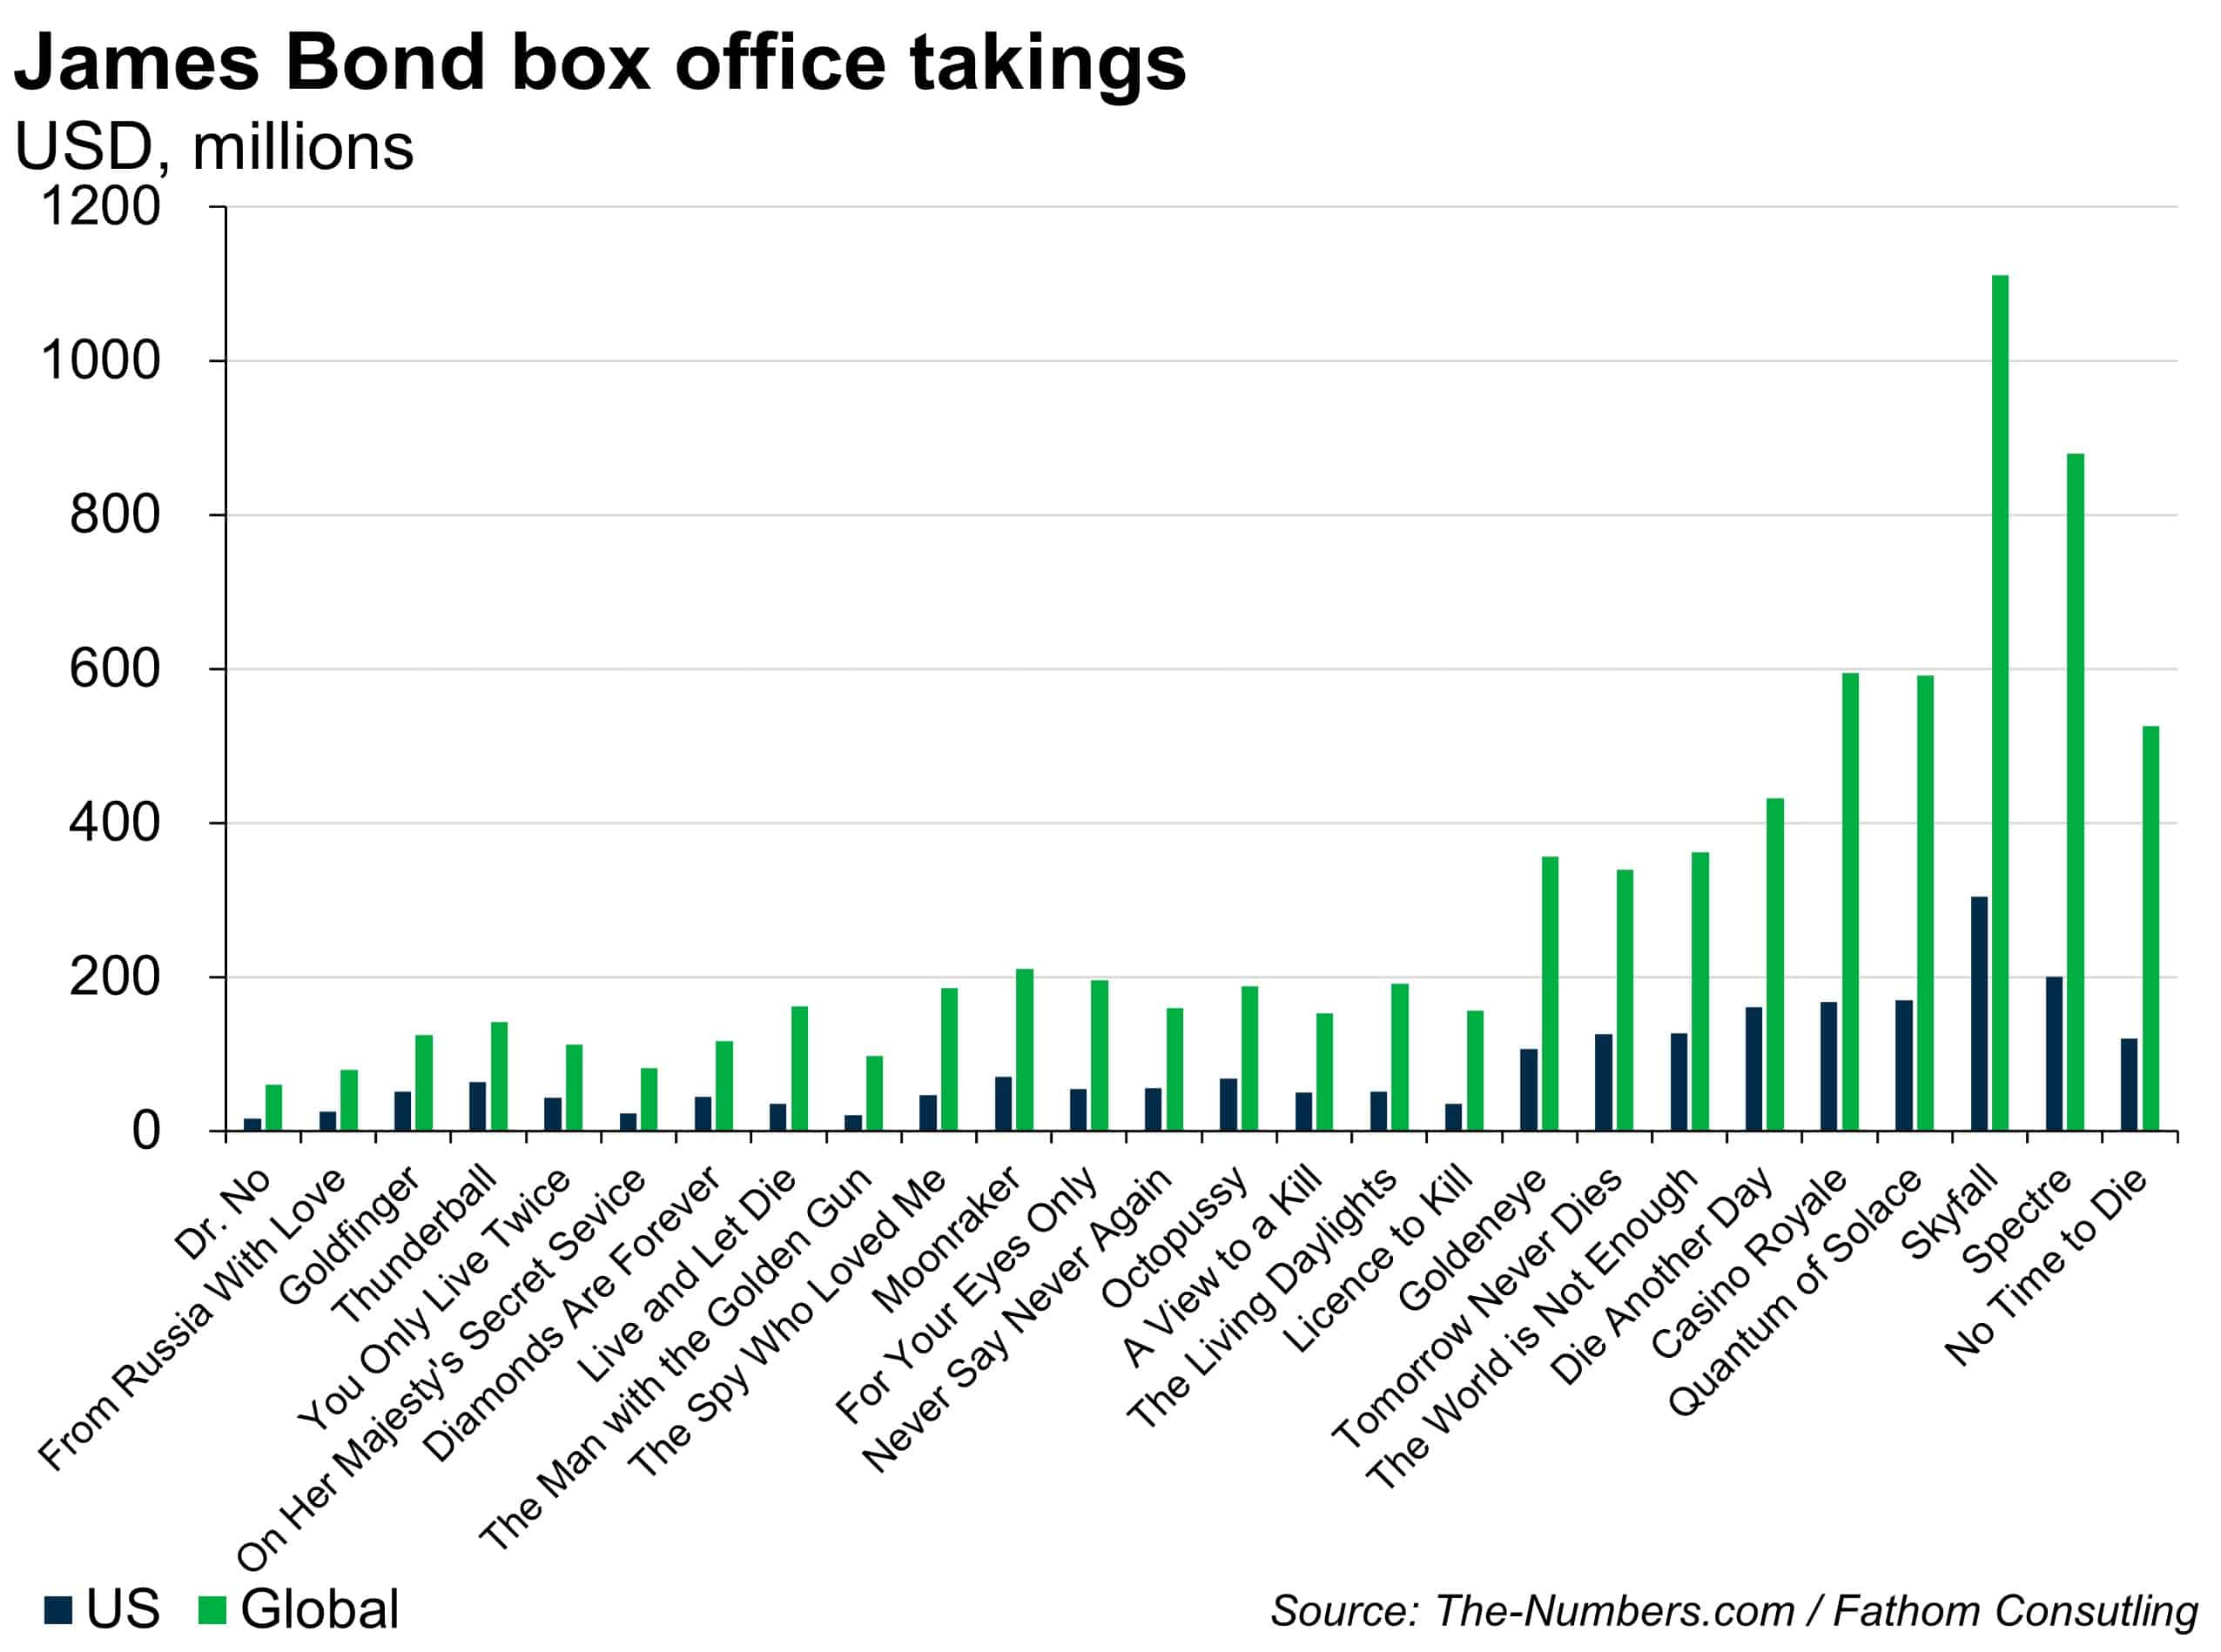
Of course, it would probably be possible to get to the bottom of this, but I don’t intend to become an industry expert for the purposes of a Friday afternoon blog. So, let’s take another approach. The chart below shows the global box office takings for each Bond film. As you can see, the more recent entries have earned far more money than earlier releases in the franchise, with a notable uptick in revenue visible following Pierce Brosnan’s debut in Goldeneye (yet another film that ends with the death of Sean Bean).
I can already hear you screaming “INFLATION” at your computer screens. So, let’s take account of that. Back in 1962, the price of a UK cinema ticket was around 14 pence according to TerraMedia with data from the UK Cinema Association showing that had risen to £6.75 last year. For our readers stateside, IMDb data show US ticket prices rising from $0.85 in 1963 (when the film was released in the US) to $9.37 in 2020. The Sankey diagram below (yes, that’s what it’s called), compares the performance of Bond films at the US box office before and after accounting for this increase in ticket prices.
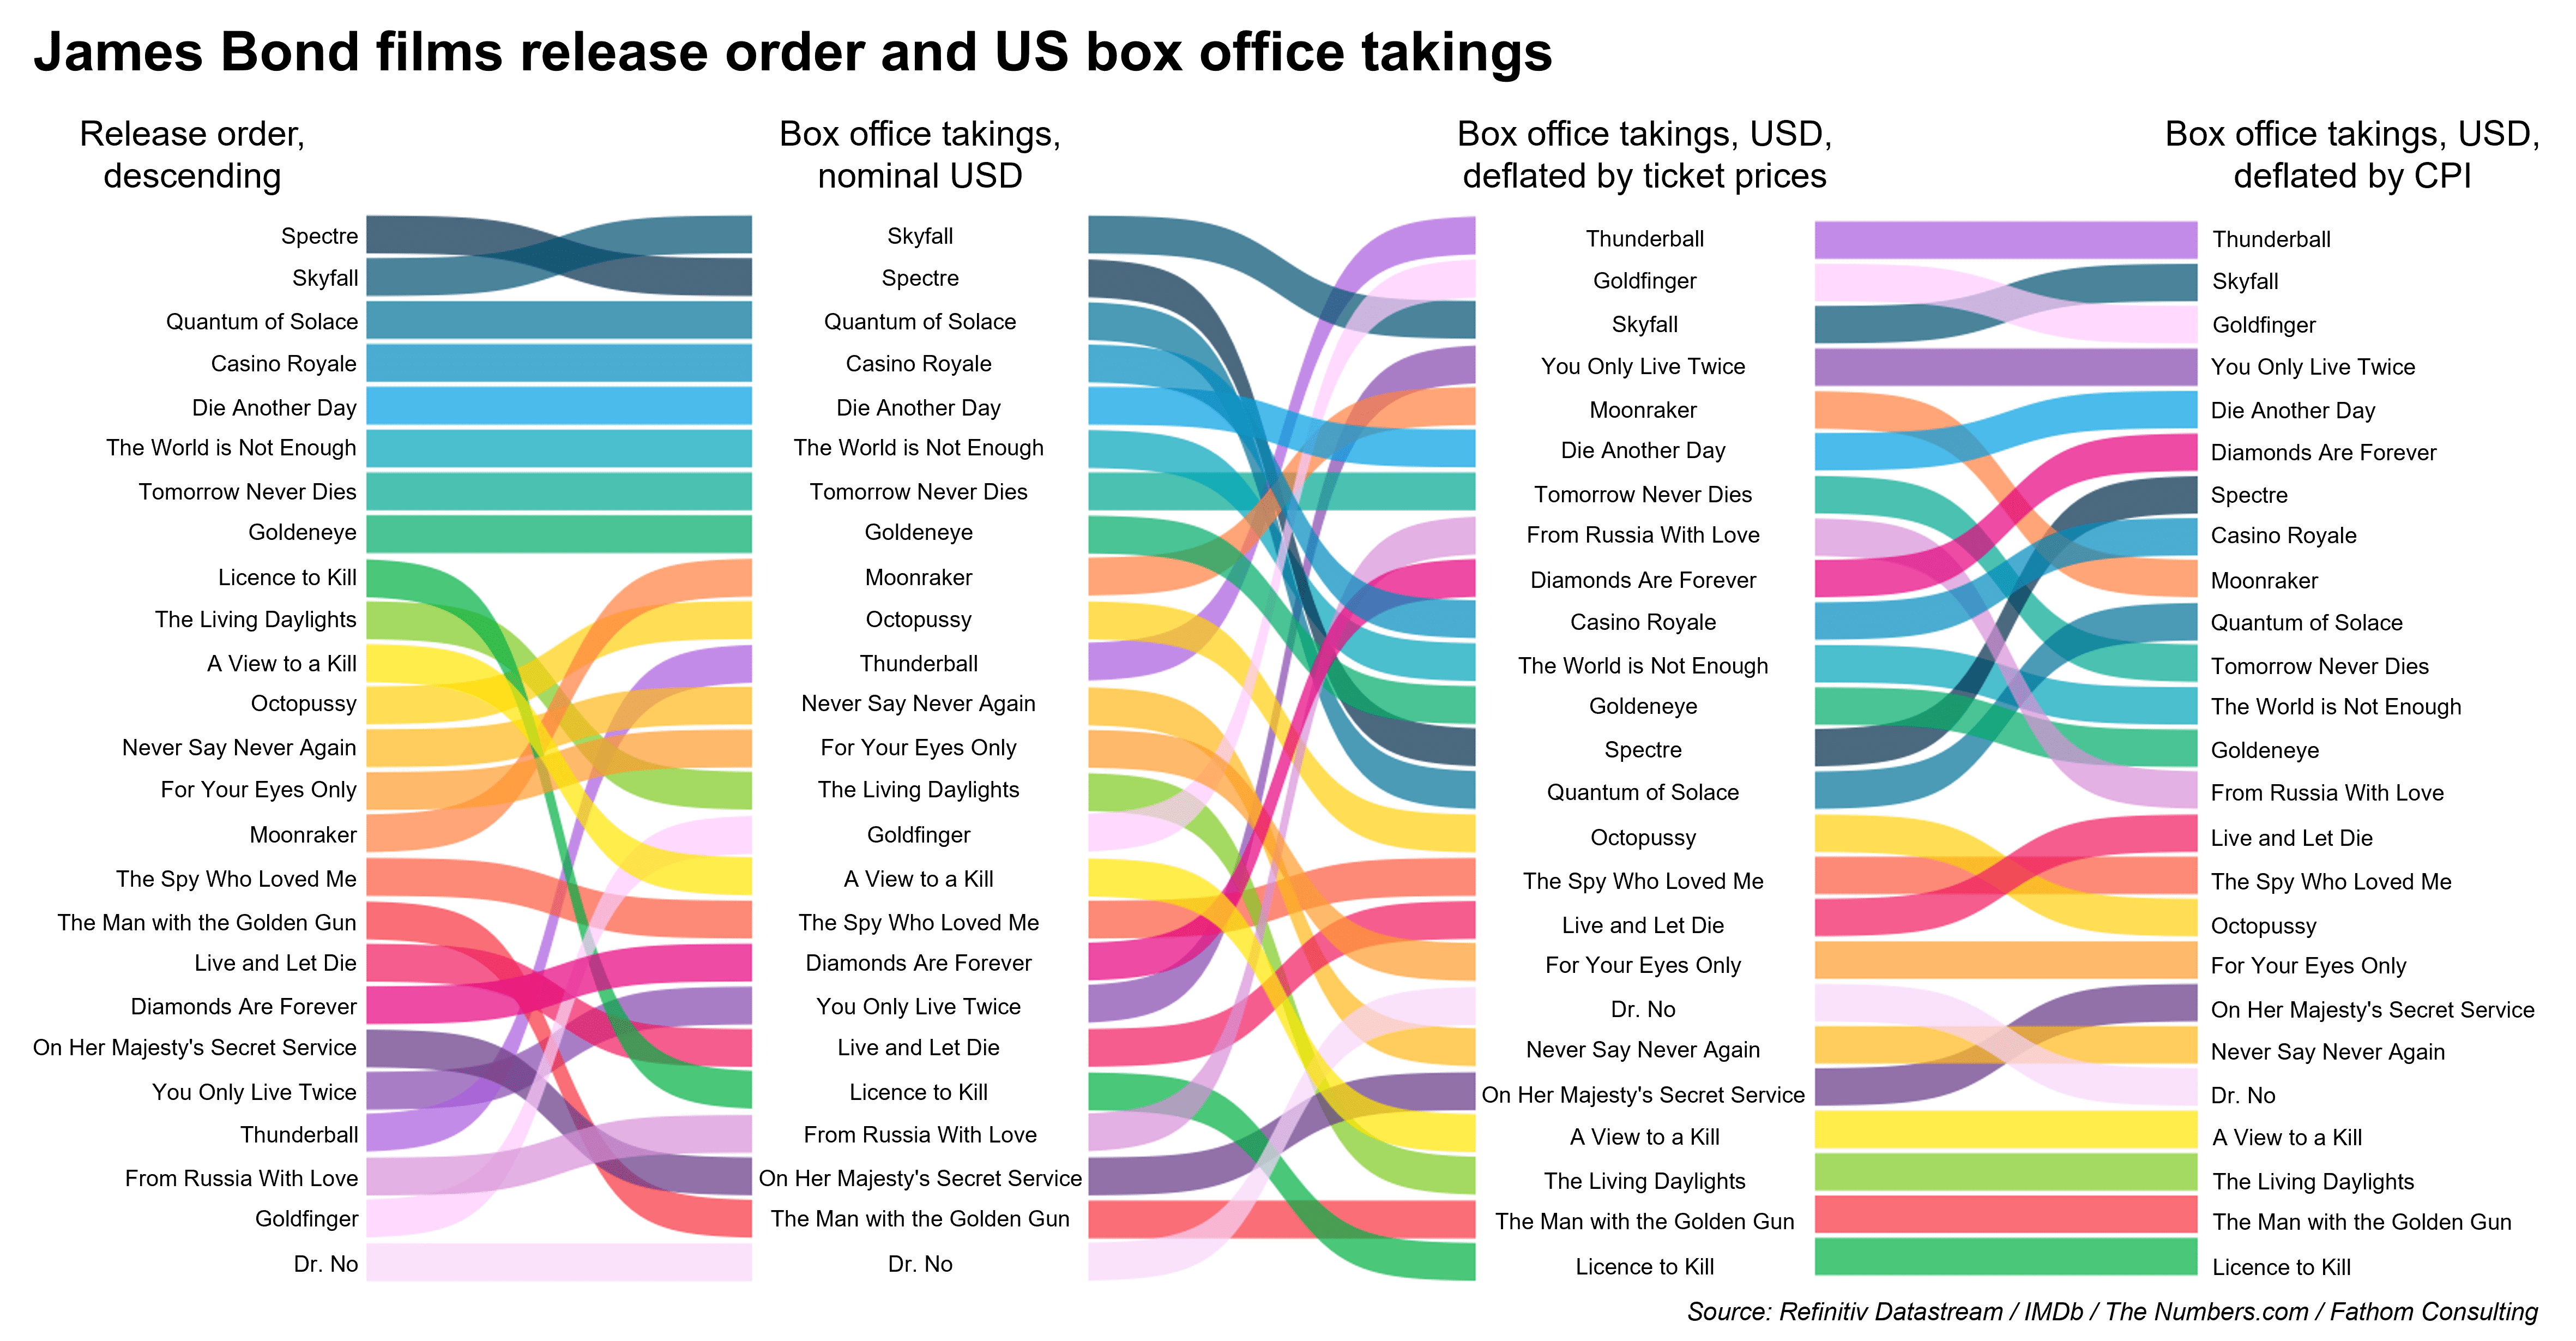
When viewed through this lens, the story changes dramatically with Connery-era Bond responsible for the franchise’s two greatest hits — Thunderball and Goldfinger. Skyfall, the highest ranked in nominal terms, slips to number three on the list. Two other Craig releases (Spectre and Quantum of Solace) begin to look like box office flops, with each falling eleven places down the ranking.
But is the price of a ticket really the best deflator? One might argue yes, since it should give a rough estimate of the number of people coming through the cinema doors. But, there are other ways you might choose to deflate revenue. For example, you could opt to deflate by the consumer price index (a broader measure of prices, reflective of the overall costs borne by consumers). In most cases, the results are similar to those obtained when deflating by ticket prices. In this world, From Russia with Love is the big loser, falling six places down the ranking while Spectre recovers six places. In short, the choice of deflator matters a lot.
So, we know the price of cinema changes over time, but how does it vary across the UK? Conceptually, it shouldn’t. According to the ‘law of one price’ (LOOP), the cost should be the same, once the expense of travel between screens is taken into account (otherwise, you’d just visit the cheapest). The map below was constructed by comparing ticket prices at various cinemas around the UK.
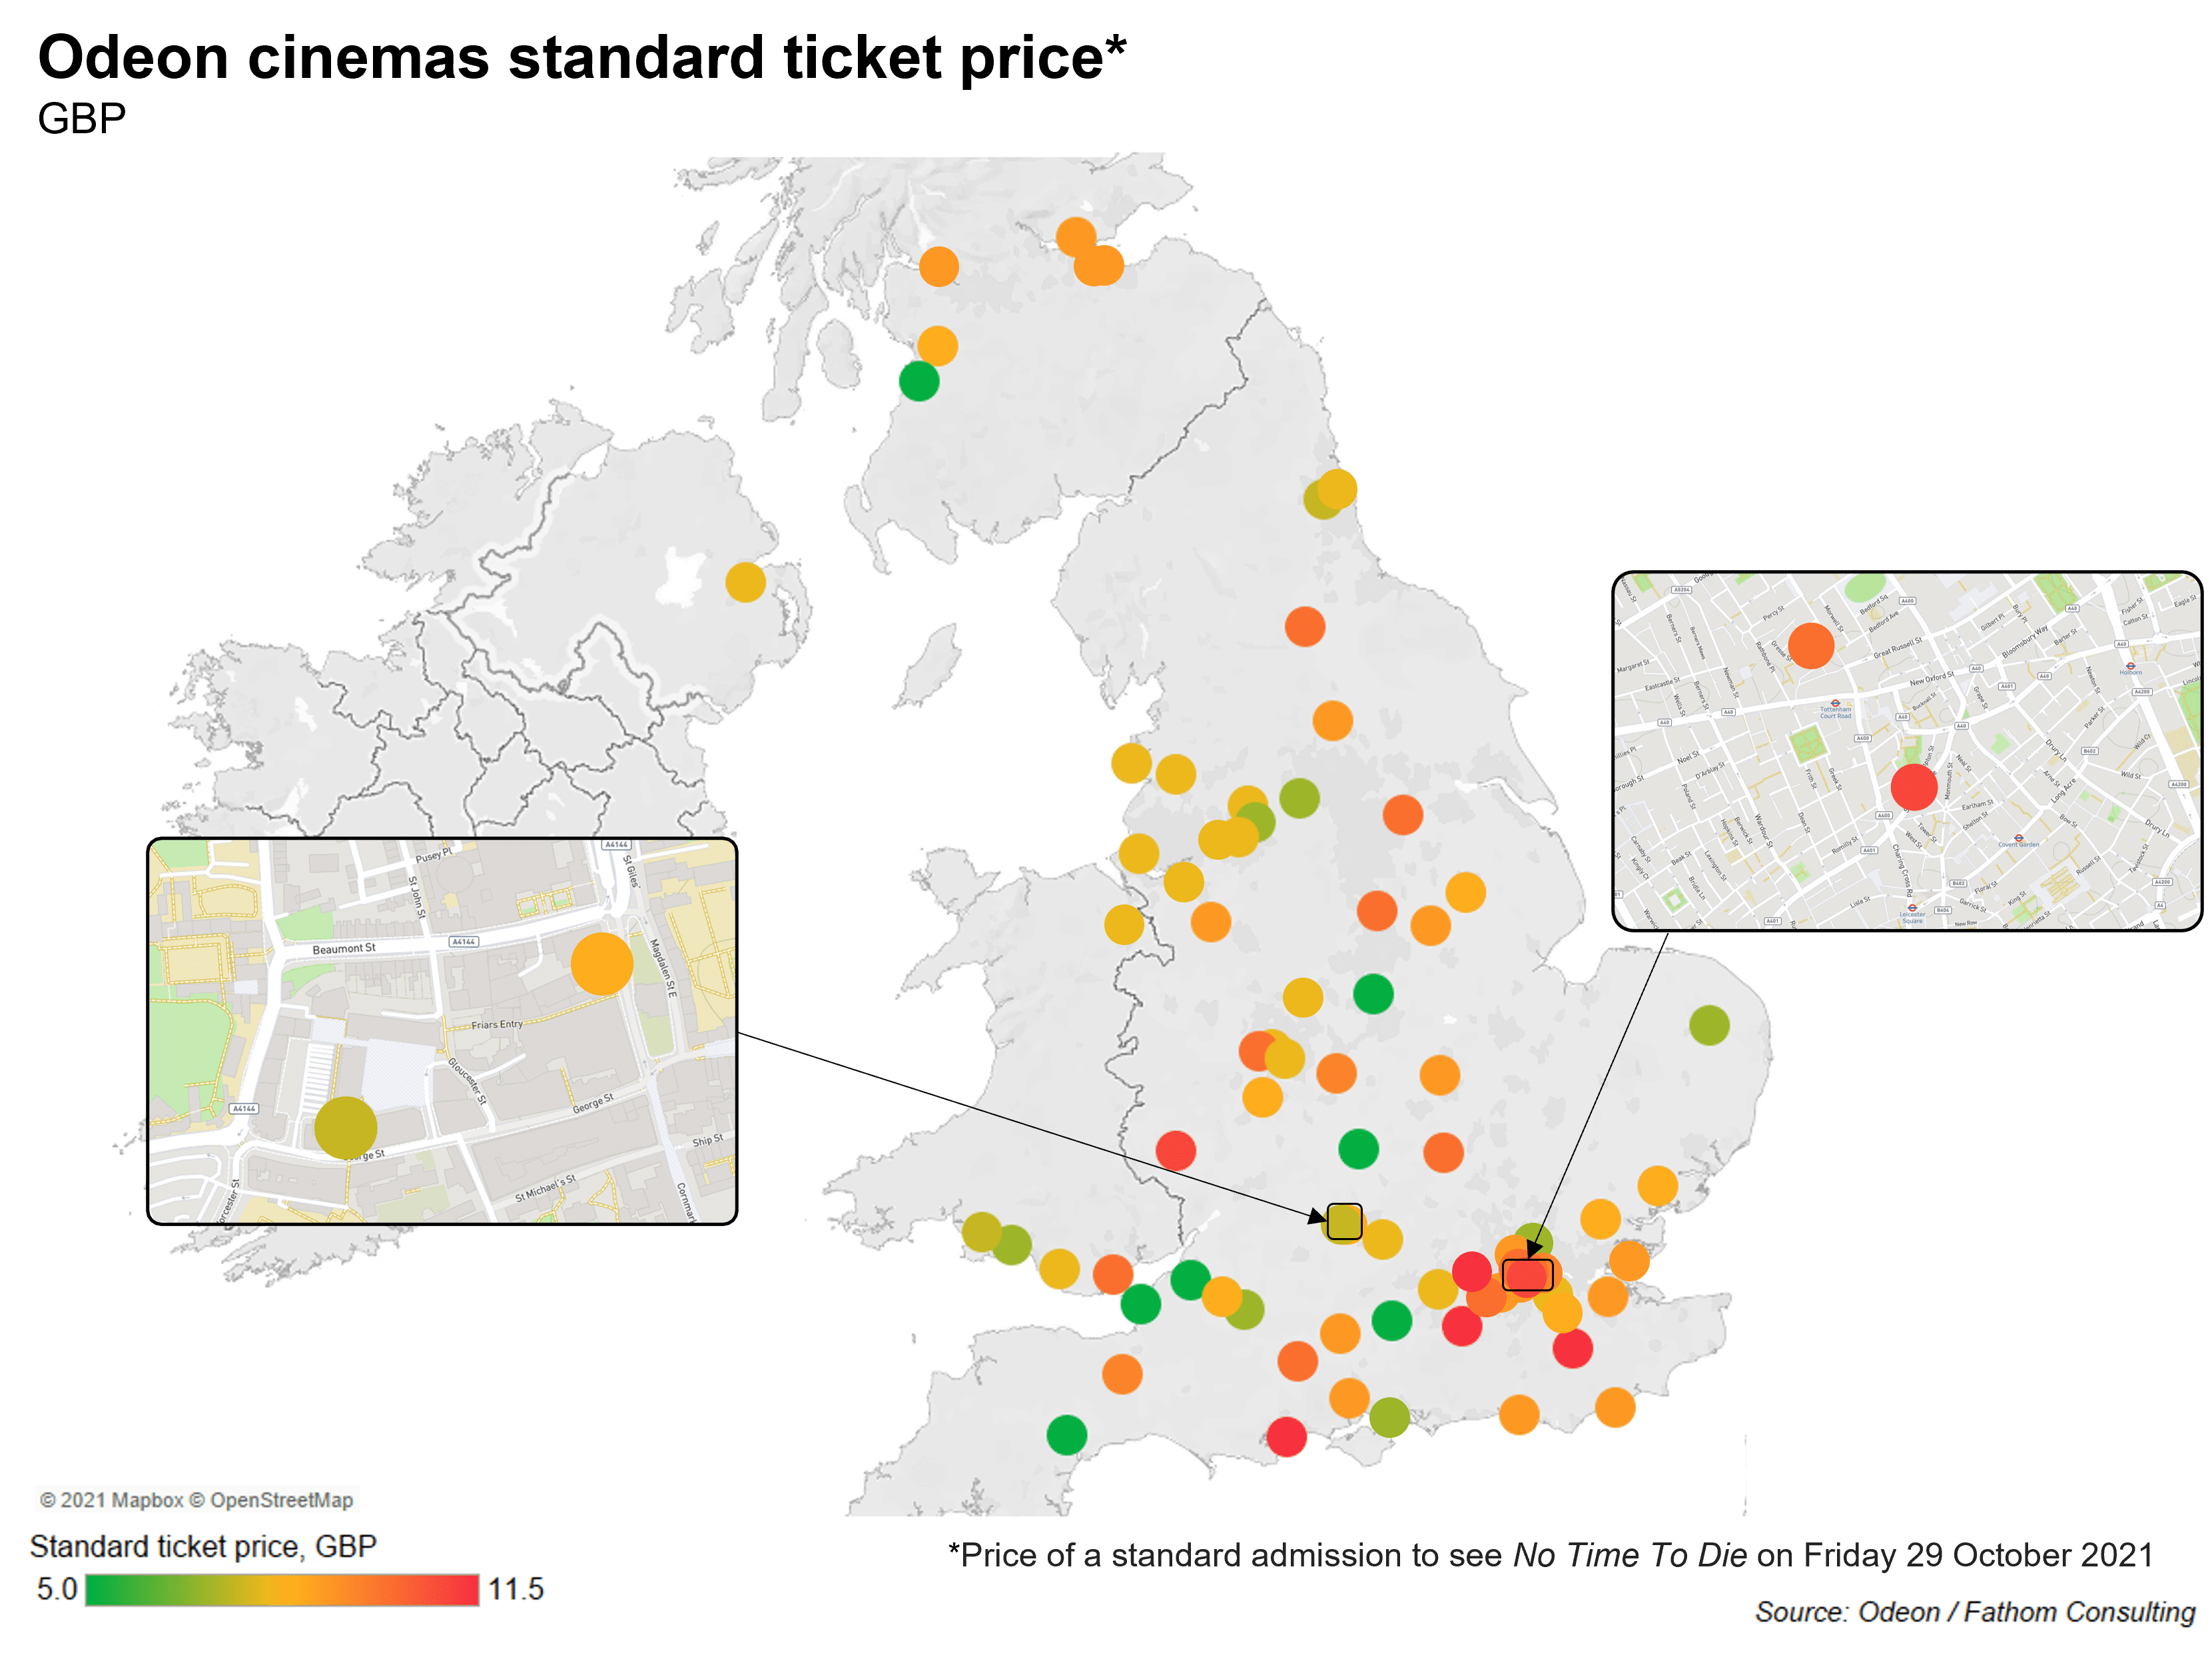
In some cases, LOOP holds (for example, the cost to view in each of Edinburgh’s two Odeon cinemas is the same). But this isn’t always the case. The map below flags two notable examples — Oxford (George Street and Magdalen Street) and London (Covent Garden and Tottenham Court Road). In both cases, the cinemas are within walking distance of each other and yet the price differs by £1.
Does this mean the LOOP is violated? Not necessarily. There could be differences in quality (comfort, screen size etc.) that can’t be observed through online prices. We might be able to test this by visiting each picture house. But, while James Bond may have no time to die, I (Harris, Andrew Harris), have no time to spy (on each of the cinemas). So for now, we’ll have to leave the debate over the LOOP as an open question.