

A sideways look at economics
From walking into the office on my first day to entering the final weeks of my year-long placement here, there has been one constant in the Fathom office: and that is Andrew Harris asking if you want to grab lunch. What seems at first like a trivial question quickly becomes more complicated when you are a student living in London with a limited budget. As any good economists would, my fellow placement students and I realised that the answer to his question could probably be found in a spreadsheet, and so the Placement Student Lunch Index was born…
Office lunches are not cheap. Premium salad bowls have become a fixture of city working culture, and it’s not uncommon for coffees to reach over £5. More broadly, as the cost-of-living crisis has taken hold there has been a noticeable rise in ‘treatonomics’, or treat spending. This is the idea that even during periods of tighter budgets, people still justify smaller indulgences that provide an immediate sense of reward. Hybrid working has reinforced this further. With fewer people commuting into the office every day, office attendance feels more like an occasion – an indulgent lunch feels easier to justify when it only happens a couple of times a week. For students, however, these trends don’t equate to viability. Spending £12 on lunch three times a week may not feel significant in isolation, but over the course of a year that would add up to over £1700 spent on salads, wraps, and what have been gracefully coined as corporate slop bowls.[1]
So when you fancy a midday pick-me-up but find yourself spoiled for choice, whilst also not wanting to risk being robbed for a plate of leaves and a grilled chicken breast, how do you decide where to go? This was the question our spreadsheet was created to answer. Twelve months of testing, 26 options (and counting), six categories each with representative weightings, and countless refinements: over the past year we scored locations on factors ranging from affordability and portion size to distance and even ‘vibes’. Before long, our lunch was no longer just a midday break, but a daily economic decision shaped by budget constraints and trade-offs.
Despite originating just as a way to keep track of our many opinions, it ended up being a tool for us to solve a core microeconomic problem: utility maximisation subject to a budget constraint. For younger workers facing London prices, that constraint has little room for manoeuvre. The same £10.45 salmon poke bowl[2] that serves as a perfectly reasonable Tuesday lunch for a senior city worker represents a meaningful chunk of a student’s weekly budget. An impromptu trip to Wagamama’s and a quick stop at Gail’s might provide high utility in the moment, but that will be short-lived if it means beans on toast for the rest of the week.
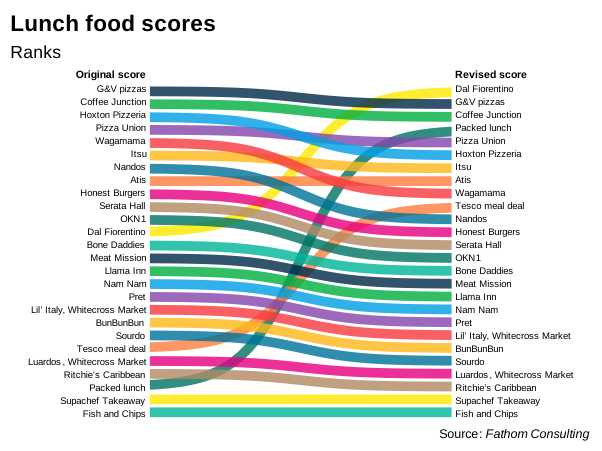
Given rising prices, the domination of the corporate slop bowl and the treat psychology of the twice-weekly office commute, the factors influencing our lunch choices were always going to be complex; and at first our scoring system struggled to capture them. We soon noticed that even though the scores were responding to our stated criteria, they didn’t reflect truly our favourite places. Week after week, affordable places with good seating options landed at the top of the table, even if we only visited once and never again; while our recurring favourites got lost in the middle of the table. Dal Fiorentino (better known in the office as “the Italian sandwich shop”) is one of the clearest examples. Despite being one of the most visited locations on the list and a firm Fathom favourite, it initially only ranked eleventh because of its lack of seating.
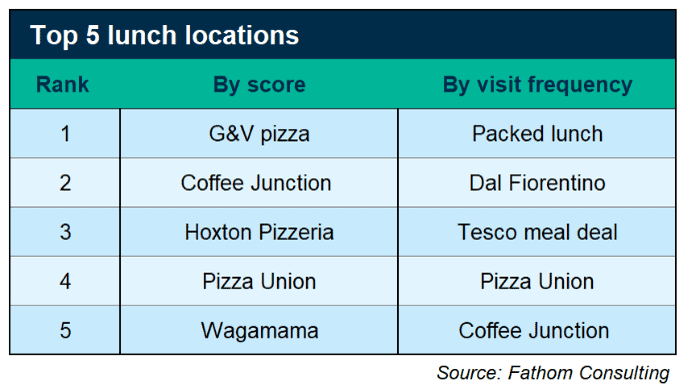
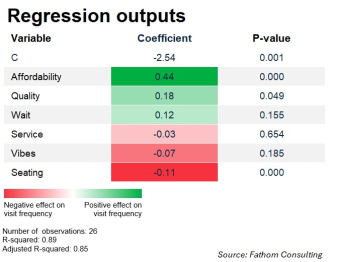
The issue was a classic economic problem hiding in plain sight: the difference between stated and revealed preferences. Stated preferences are the qualities we claim to value most: in our case, this was food quality, affordability, seating and vibes. Revealed preferences are what our behaviour actually shows, which in this case was us was turning up to Dal Fiorentino and the Tesco meal deal chiller cabinet week after week, regardless of what the scores said. To understand which of our scoring criteria were driving our choices and which were noise, we put our university coursework into action and ran a regression on the data, trying to explain the number of visits as a function of our six categories. At the 5% significance level, three of the six factors we’d spent twelve months carefully weighting (quality, affordability, and seating) turned out to be statistically significant. Seating options carried the most surprising result, being associated with repeat visits in the opposite direction to our spreadsheet’s assumptions: worse seating was associated with more visits! This doesn’t mean we were actively seeking out uncomfortable lunch spots: rather, places with limited seating are often quick takeaway options that also tend to be faster and more affordable. In other words, poor seating may have just been a proxy for cost and convenience. With an R-squared of 0.89, the model explained a good portion of the variation in where we ended up eating, but with half of the variables falling short of individual significance, it was clear that not everything we’d been meticulously marking was actually having an impact on our decision-making.
Realising that our scoring system that didn’t work at reflecting what we thought was best, we decided to include ‘number of visits’ as a multiplier on each location’s final score. In doing so, we captured both our stated and revealed preferences in a single ranking and began to agree with the results the spreadsheet was showing. In the end, our observed behaviour pointed to a more believable story: the go-to lunch choice was ‘whatever is within 10 minutes of the office and under £10’.
This isn’t just a quirk of our lunch spreadsheet. Gaps between what people say they value and what their behaviours show constantly appear in economics and policymaking, where the stakes are considerably higher. A poor lunch order may ruin your afternoon; a policy built around incorrect assumptions can take years to implement, millions to fund, and decades to fully reverse. Fortunately for us, the cost of failing to understand our true preferences was a soggy sandwich, rather than a multi-year spending commitment. Twelve months of testing taught us that knowing which spots offer the best value, the shortest wait, and the highest chance of leaving satisfied, makes a genuine difference when surviving on student budget. However, it also taught us that economic theory can only take you so far… What you fancy on a random rainy Monday in March cannot always be explained by a black-and-white spreadsheet, and every once in a while, the £12 salad bowl is entirely justified. Lunch decisions, it turns out, involve trade-offs that no model fully captures. For many, a meal deal will always be the go-to; for others it might be a salmon poke bowl, and for some ‒ Andrew Harris included ‒ the company matters more than the food itself.


More from Thank Fathom it’s Friday
A socially optimal dinner party
Chewing over some food economics
[1] A nutritionally dense but financially questionable bowl-based lunch category popular among city workers. Usually a pick-and-mix fare consisting of leaves, grains, and some form of protein.