A sideways look at economics
When I worked at the Bank of England, many years ago, a (very) senior official once asked why Bank staff felt the need to seasonally adjust the raw retail price index (RPI). If I’m going to be generous, I might say that this was a rhetorical question: he was merely encouraging a group of economists, many fresh out of university, to think through why some prices might vary in a systematic way through the year.
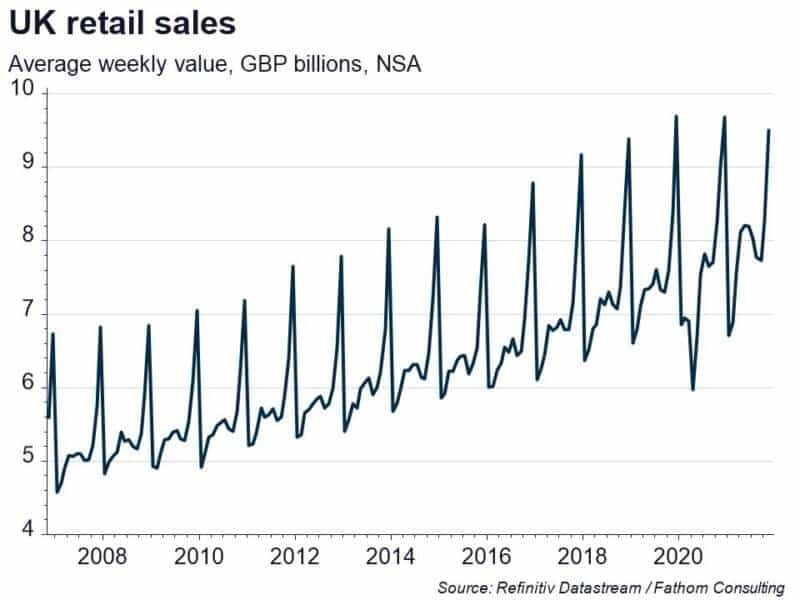
Many macroeconomic data display seasonal patterns simply because the way we like to conduct our lives varies through the seasons. Take retail sales, for example. In the ten years leading up to the pandemic, UK retail sales in the month of December were, on average, 34% higher than they were in the other eleven months of the year, while in January they were 12% lower. With most of this variation reflecting changes in demand rather than supply, it is perhaps little surprise that prices of goods in the shops tend to rise in December and fall in January. In those ten years, the retail sales deflator, which measures the prices of all those items in the retail sales basket, rose by an average of 1.7% in December and fell by an average of 3.8% in January.
This creates an arbitrage opportunity. Knowing that many things we buy tend to rise in price in December, and then fall in price in January, we could simply defer our usual December purchases until the New Year. But thanks to the work of Charles Dickens, we have a word for people who think like that.
Some systematic variation in the prices of things we buy in the shops is, to a degree, understandable. But systematic variation in financial market prices makes at least some economists feel uncomfortable, because it appears to violate the efficient markets hypothesis (EMH) – the idea that there is no systematic, and hence exploitable, bias in the way the market prices different assets. The EMH says that as an investor you can enjoy higher returns than other investors, on average, but only by taking more risk. In other words, there is no such thing as a free lunch. In a chapter called ‘Seasonal anomalies’ in The Handbook of Equity Market Anomalies,[1] Constantine Dzhabarov and William Ziemba review the literature on seasonal fluctuations in equity prices that appear to run contrary to the EMH. They find that some of the identified anomalies have disappeared over time, either because investors started to exploit them, and thereby remove them, or perhaps more plausibly because the supposed anomaly was never really there in the first place – it was found through a process of data mining.
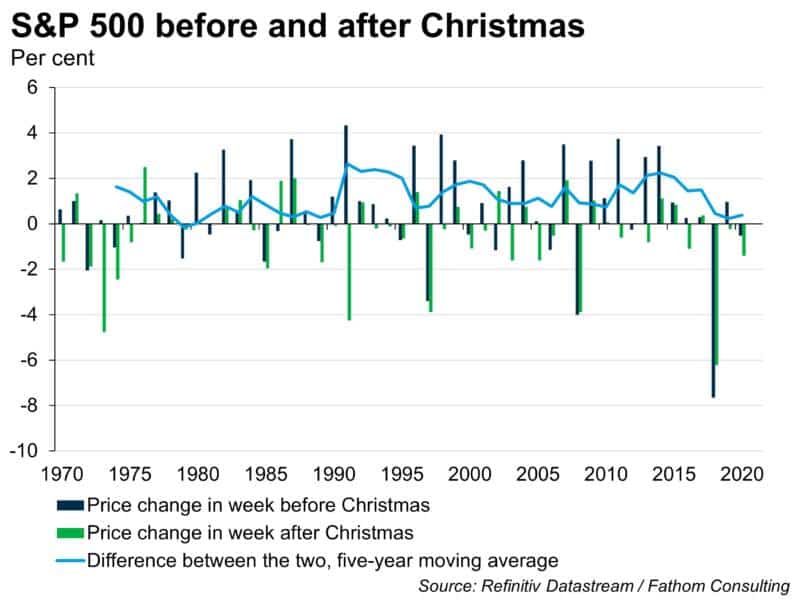
One fairly stubborn and well-known anomaly, which my former colleague Oliver Jones discussed five years ago, is the tendency for equities, and for US equities in particular, to outperform in the days just prior to a public holiday. Dzhabarov and Ziemba cite three separate studies, published between the mid-1980s and the early-1990s, that documented this effect. It looks to us as if it might still be there, at least around Christmas time. In our final chart we compare the change in the S&P 500 in the five trading days leading up to Christmas (dark blue bars) with the change in the S&P 500 in the five trading days immediately after Christmas (green bars), and show the difference between the two, smoothed over five years (light blue line). Since 1970, the S&P 500 has on average risen 0.64% in the week before 25 December (an annualised price return of 40.0%) and fallen 0.47% in the week after 25 December (an annualised price return of -21.7%). And in the 51 years covered by our chart, the S&P 500 in the week before Christmas has outperformed the S&P 500 in the week after Christmas on 37 occasions.
At the time of writing, the S&P 500 is up 1.6% on its position at the end of last week. If sustained until close on Christmas Eve, that would imply an annualised price return of 54.7%, and Santa would have been even more generous than usual this year.
Team Fathom would like to wish everyone an enjoyable Christmas break, and a healthy and happy 2022.
[1] Zacks, Leonard (ed.) (2011), The Handbook of Equity Market Anomalies, John Wiley & Sons.