A sideways look at economics
I spent my Bank Holiday Sunday at Wembley. It was a major milestone for my team, Charlton Athletic, as it was the first time the club has played at Wembley since the new stadium was opened in 2007, and the first appearance at the national stadium since 1998. In truth, it wasn’t the Greatest Game, but the victory was memorable nonetheless.
In the time it has taken Charlton to get back to Wembley, the transfer record has increased ten-fold, from the £19.5 million paid for Ronaldo’s services to Neymar’s eyewatering £198 million fee. 1998 also saw 2019 Premiership winners Manchester City being relegated to England’s third tier. How times change… The global economy also went through some substantial changes over the last 21 years, most notably the bursting of the Dot-com Bubble, a global financial crisis, quantitative easing and negative interest rates, and a substantial and persistent drop in productivity growth.
But the real question, both for Charlton and the global economy, is not what happened in the last 21 years, but where do we go from here?
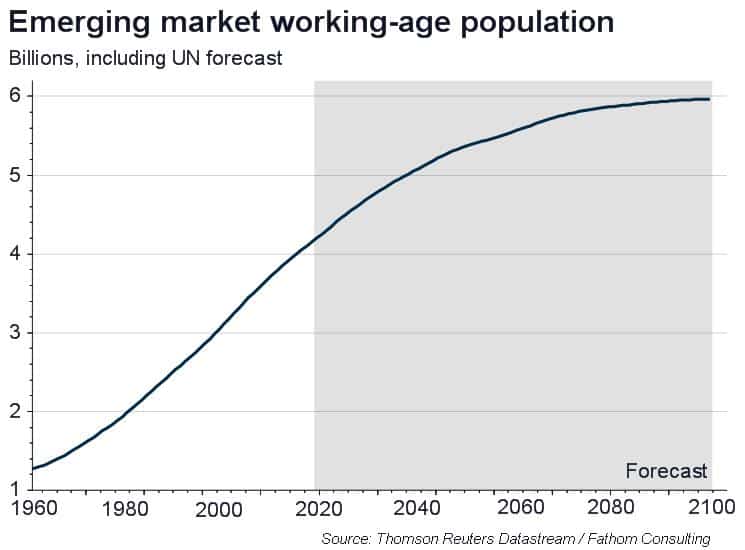
Ultimately, as most macroeconomic models will tell you, long-term economic growth is determined by two factors ― the size of the labour force and how productive it is. As we have highlighted to our clients in our forecast presentations, many advanced economies are currently hamstrung by weak productivity growth and a declining working-age population, and are therefore likely to experience lower growth rates in the future.
Handily, the United Nations publishes population projections out as far as the year 2100, which allows this analysis to be extended to the rest of the world. To do this, the UN’s population projections are combined with estimates of trend employment and labour productivity.[1]
The composition of the global economy has changed substantially in recent decades, with China’s emergence and its admittance to the World Trade Organisation. The People’s Republic is now not only the world’s most populous country but also its largest economy, according to the IMF’s purchasing power parity (PPP) exchange rates.[2] The results of this exercise indicate that not only will China retain this title but that India will leapfrog the US into second place.
The other members of the G6 ― France, Germany, Italy, Japan, and the UK ― also slip back in the rankings as more favourable demographic projections enable a number of emerging economies to enjoy prolonged economic booms. Back in 1998, over 40% of global output came from the G6 but now those same six nations have already seen their share of global GDP fall below 30% and that figure is likely to dip below 20% by the end of the century.
At the aggregate level, the global economy looks set to be double its current size by the mid-2050s and three times as large by 2082. GDP on a per capita basis is expected to be two and a half times larger by the year 2100.
Obviously, there’s a great deal of uncertainty in predicting GDP growth two years ahead, let alone 80 years in the future, but the fundamentals should ultimately win out in the medium term, and economies should be expected to grow in line with their potential output. The estimates of trend productivity used for this TFiF can obviously be quibbled with, especially over such a long horizon ― productivity in advanced economies may rebound if interest rates rise and might slow faster than expected in emerging markets. But, it’s undeniable that rising populations in developing economies unlock a potentially huge source of growth and, even if per capita income in these countries remains substantially below Western levels, it’s surely set to increase as productivity rises. Regardless of the precise outcome, the future for the global economy and the majority of its citizens looks bright, much like the future of Charlton Athletic (hopefully).
Click on the buttons below to see how the composition of the global economy changes over time.
[1] To calculate a medium-term growth forecast, an estimate of the labour supply is constructed by assuming that the bulk of employment comes from the working-age population (i.e. those aged 15–64) and the employment share of the population remains constant. Labour productivity growth is assumed to be lower post crisis (although some of the shortfall is eventually recovered) and, for EM nations, also slows as economies enter the middle-income trap.
[2] Although hard to accurately estimate, PPP exchange rates are often preferred over market exchange rates for the purposes of cross-country comparisons since they avoid the volatility that is often associated with the latter. For example, using market exchange rates, the depreciation in sterling following the Brexit referendum result would suggest that UK economy shrank by 8% in dollar terms, despite the economy expanding through 2016 when measured in local currency units.