

A sideways look at economics
When I was at university we dealt very little with Gross Domestic Product, or GDP. Our courses focused instead on its theoretical counterpart, Y (economic shorthand for output or income). Y is a solid foundational bedrock; GDP is not. Rather, it’s a number that changes based on how you measure it; which is regularly revised (to my annoyance when I was forecasting Swedish GDP for the Norges Bank); and which is often used by commentators to capture far more than it is actually designed to account for.
First things first: what is GDP? The encyclopaedia defines it as the total monetary value of all final goods and services produced within a country over a specific period. There are three methods for measuring GDP, all of which should in theory give the same answer, although they do not in practice:
- The income approach, where we take the sum of all income earned by the factors of production (capital and labour) in the economy
- The production (or value add) approach, where we find the gross value of output and subtract the value of intermediate costs; e.g., when a car producer sells cars to a value of £x but has spent £y in the production of the cars, the value add for the car producer will be x-y
- The expenditure approach, where we sum what has been consumed or spent in the economy, i.e., the sum of private and public spending/consumption, private investment, and net exports (exports minus imports)
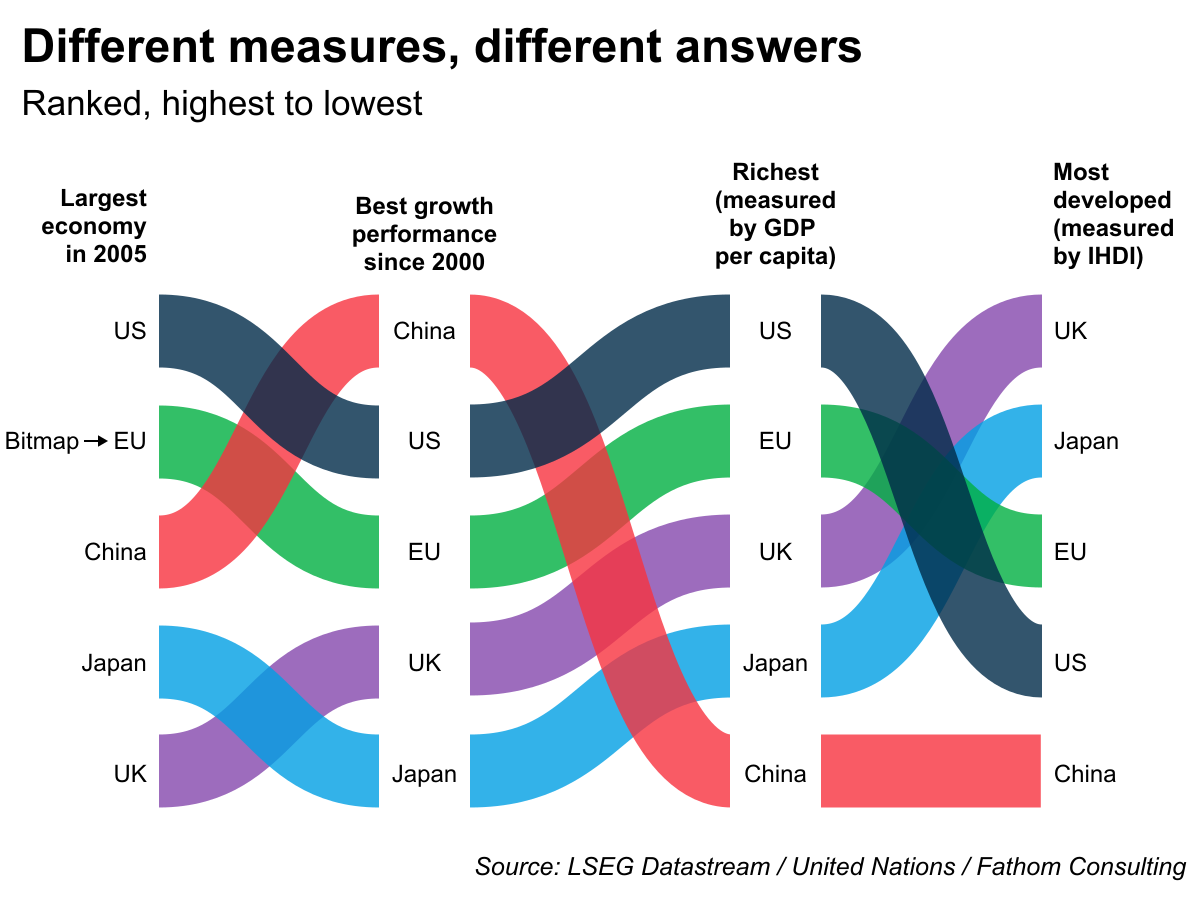
Generally, when economists are looking at GDP, it’s because we’re comparing things: for example, the relative economic size of different countries and how this has changed over time. Or we use GDP to be able to standardise other metrics: for example, when we compare defence spending between countries, we express defence spending as percentage of GDP to account for countries’ relative spending power. Take the US, Japan, EU, UK and China: what does GDP tell us about them? We see from the chart below that measured in current price (nominal) GDP in US dollars in 2025, the US is the largest of these economies, with China close to catching up to the EU, and the UK around the same size as Japan.
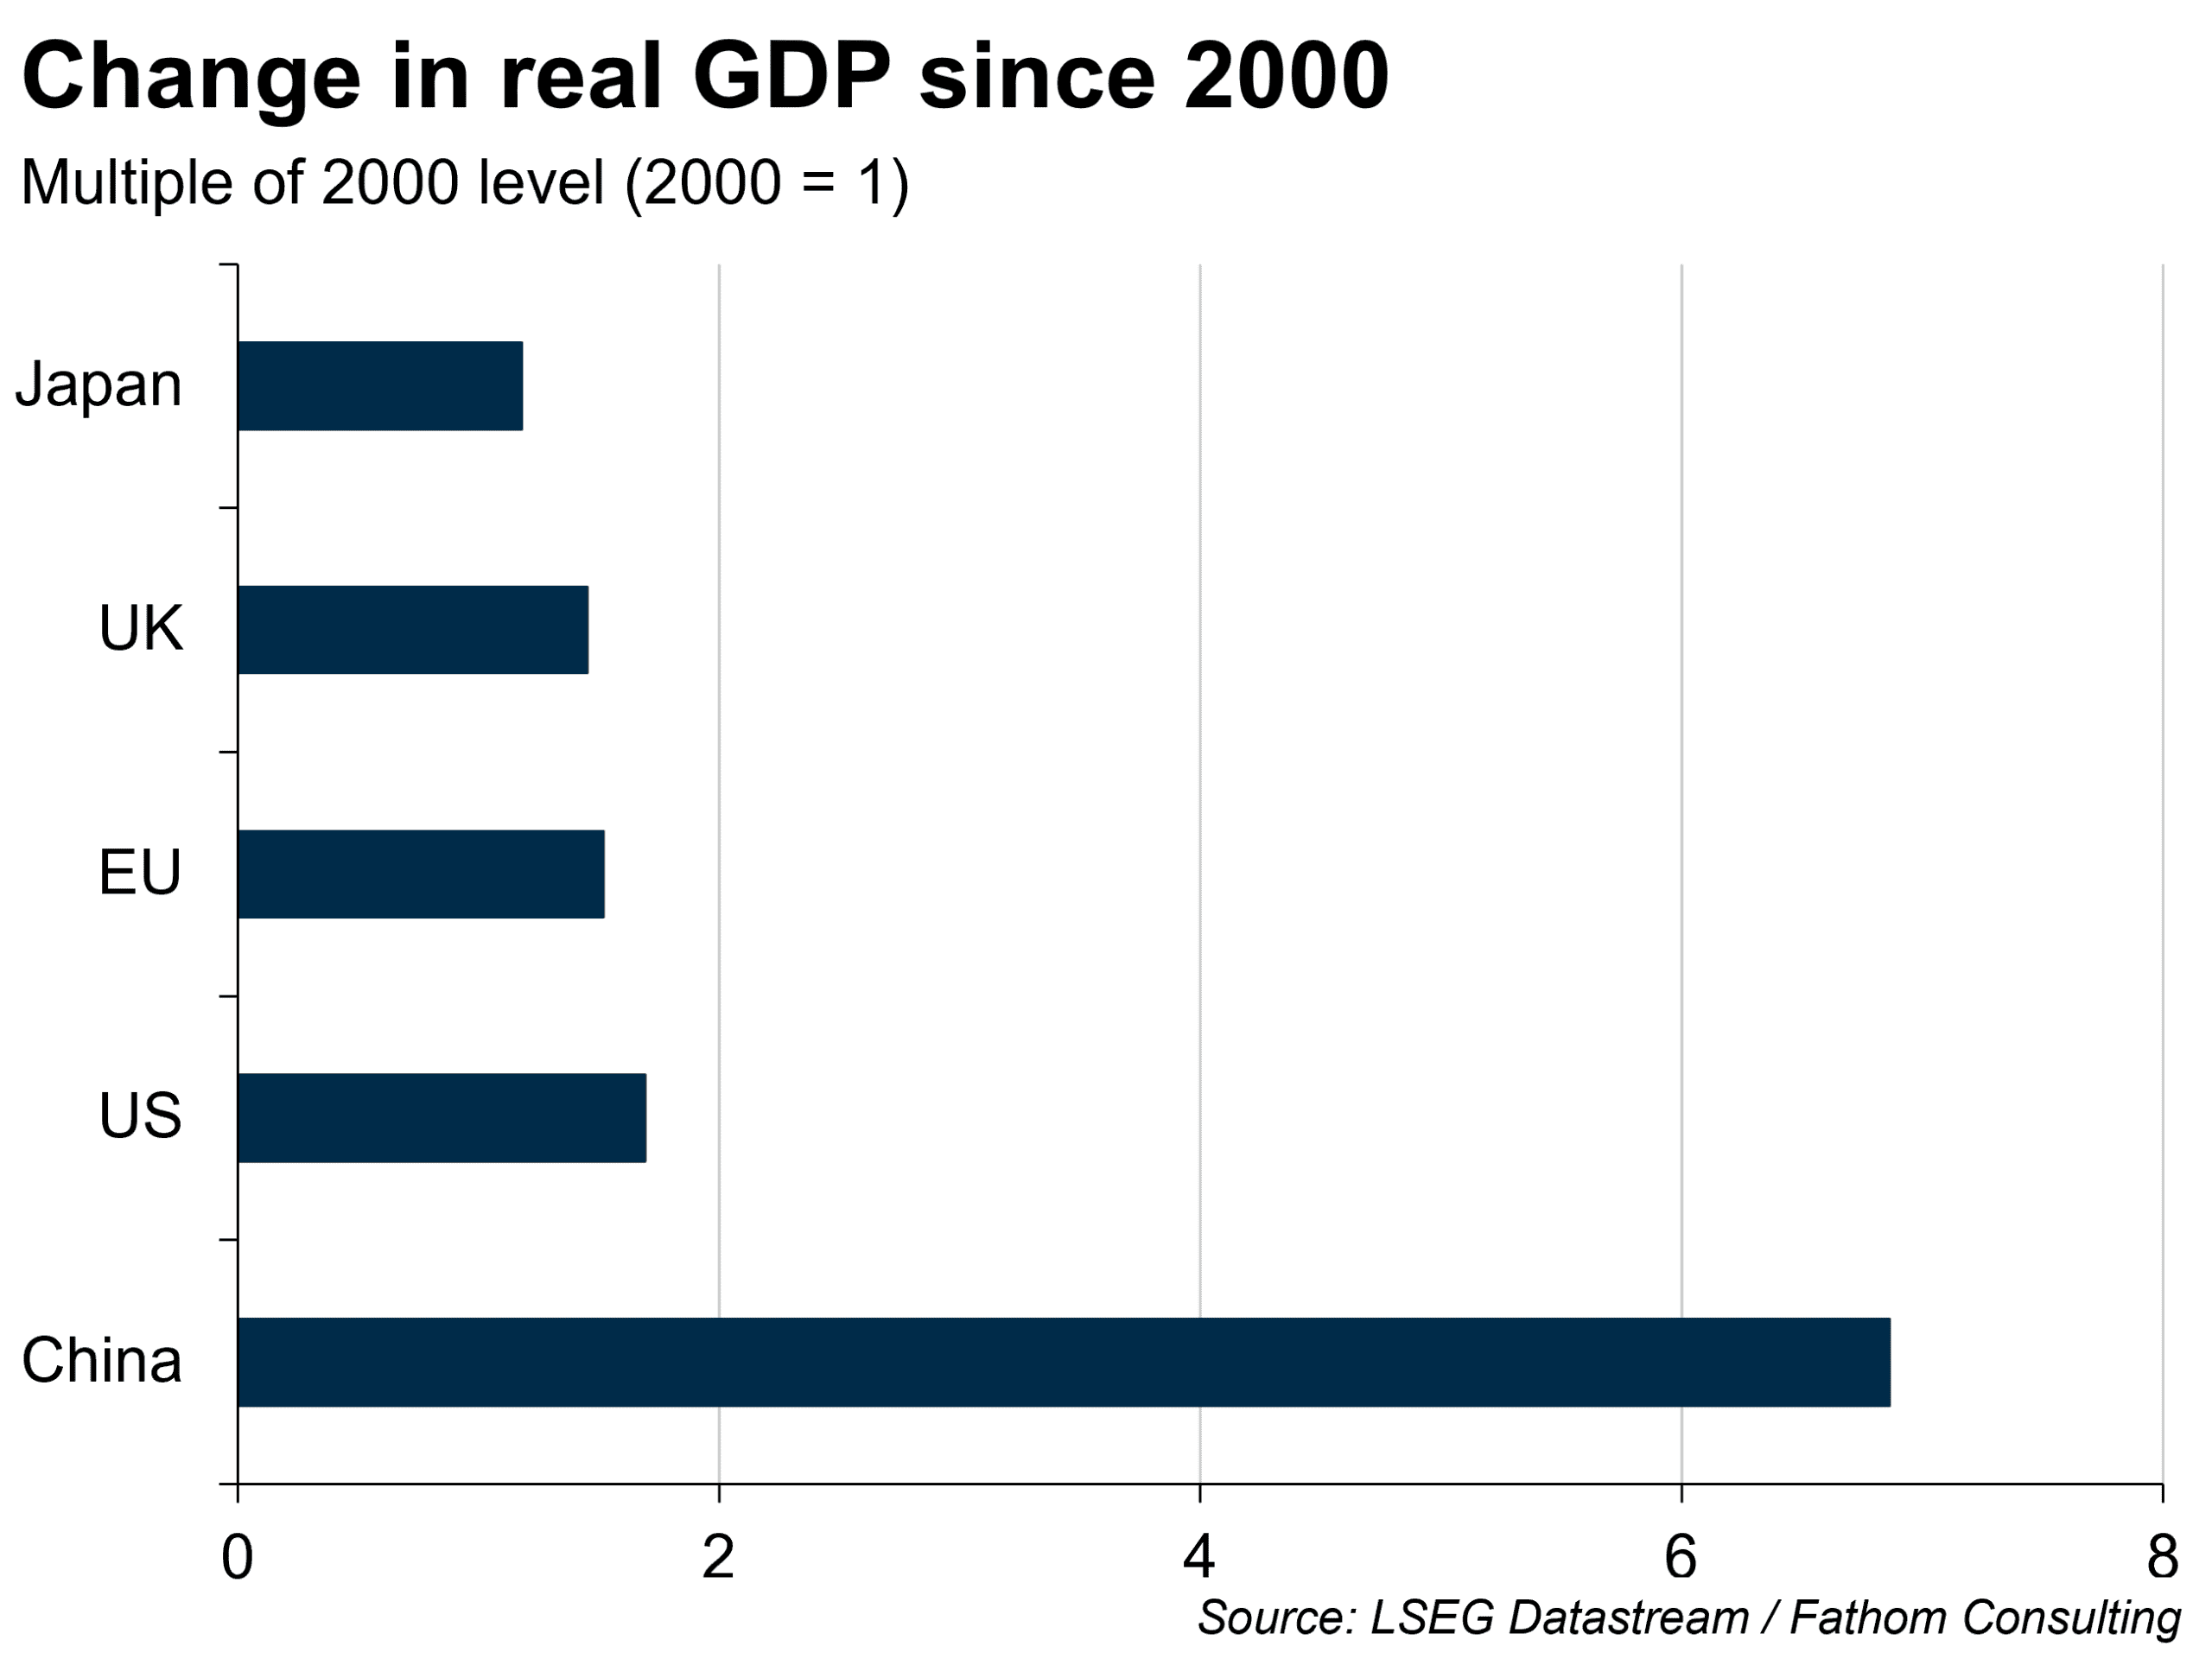
What if we wanted to know how this had changed over time? We could show a time series of the nominal numbers, but we would run into the issue of not knowing whether the economy or simply prices were driving any changes. We need to strip out these price effects by looking at GDP in constant price terms. Doing so, and comparing economies in 2000 to 2025, we find that China’s growth performance far outstrips the rest, with its economy growing nearly seven-fold over the period.
These charts may look simple, but the numbers underlying them are far from it. Tracking the total value of transactions across an economy is no mean feat. Data need to be collected on everything, from how many times you (and everyone else in the economy) bought a loaf of bread and what you paid for it, to how much investment a company like Fathom made in electronic hardware. And while statistical agencies use actual transaction values in their work, they also rely on models, surveys and estimates, making GDP a far less certain concept than we might initially think when we play around with the ‘Y’ in our econ equations.
For this reason, GDP numbers, which are released remarkably frequently given the challenges in assembling them, change and move around. But what does this mean for the inferences we draw from them? UK GDP numbers, for example, are released at a monthly frequency, but revised for a full three years after. We would think that the final release is the ‘truest’ reflection of actual economic conditions, but which investor, journalist, politician, or layman is basing their assessments on that?
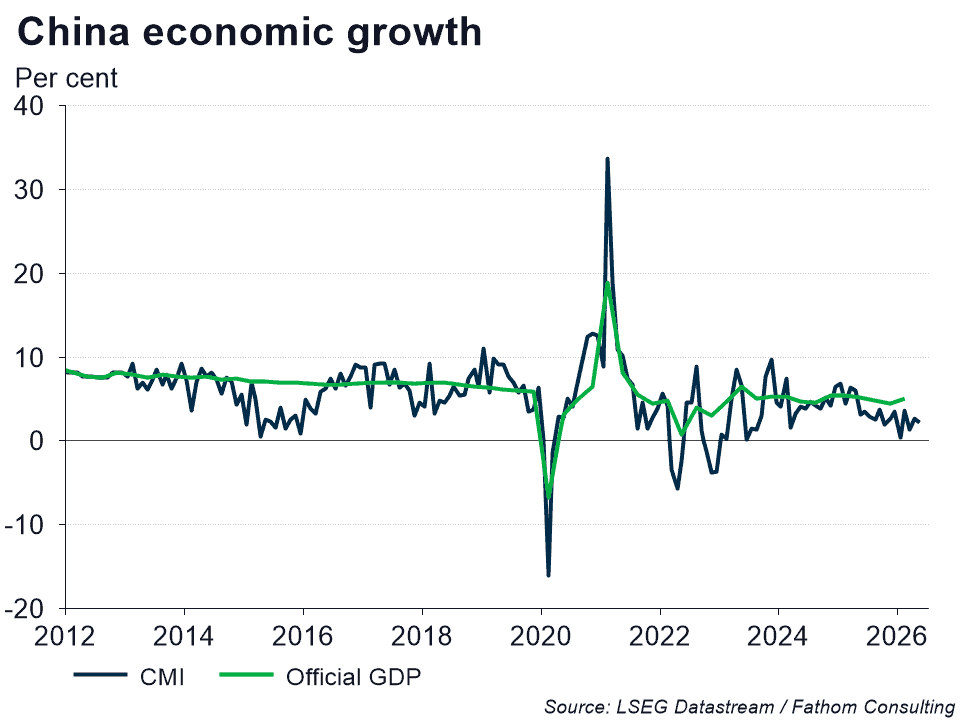
And this presumes that we trust a given country’s statistical office to release numbers that are as accurate as possible. In the case of China, Fathom along with many other analysts think this may not be the case. This view is motivated partly by the speed at which China releases its GDP figures (an impressive 15 days after the end of the quarter, much faster than the 1-3 month release schedule of other countries), as well as the general lack of revisions and overall stability of China’s GDP growth figures. Because of this we have developed our own measure of China’s GDP, the China Momentum Indicator (CMI), a monthly measure of China’s GDP growth based on a number of other activity indicators that can tell us something about what is going on in the economy, such as electricity production, retail sales, and trading partner import and export statistics. But if we use the CMI as our measure of China’s GDP growth from the start of the CMI in 2012, we find that not only is China’s economy smaller, by about 9%, than official statistics would indicate, its growth is also slowing more rapidly.
Even where we trust that numbers are as ‘accurate’ as they can be, we may still need to be careful in drawing inferences. The headquartering of large multinationals in Ireland owing to the country’s attractive corporate tax policies skews GDP growth figures, even when the only activity that has actually taken place is some shifting around of numbers on corporate balance sheets. Ireland’s Central Statistics Office (CSO) will therefore often report a modified version of gross national product (GNI*) along with GDP figures, with growth rates of the former usually far lower than those of the latter.[1] Similarly, the meteoric rise of GLP-1 drugs boosted values from Novo Nordisk to such a degree that the Danish statistical agency began publishing GDP estimates with and without the pharmaceutical sector.
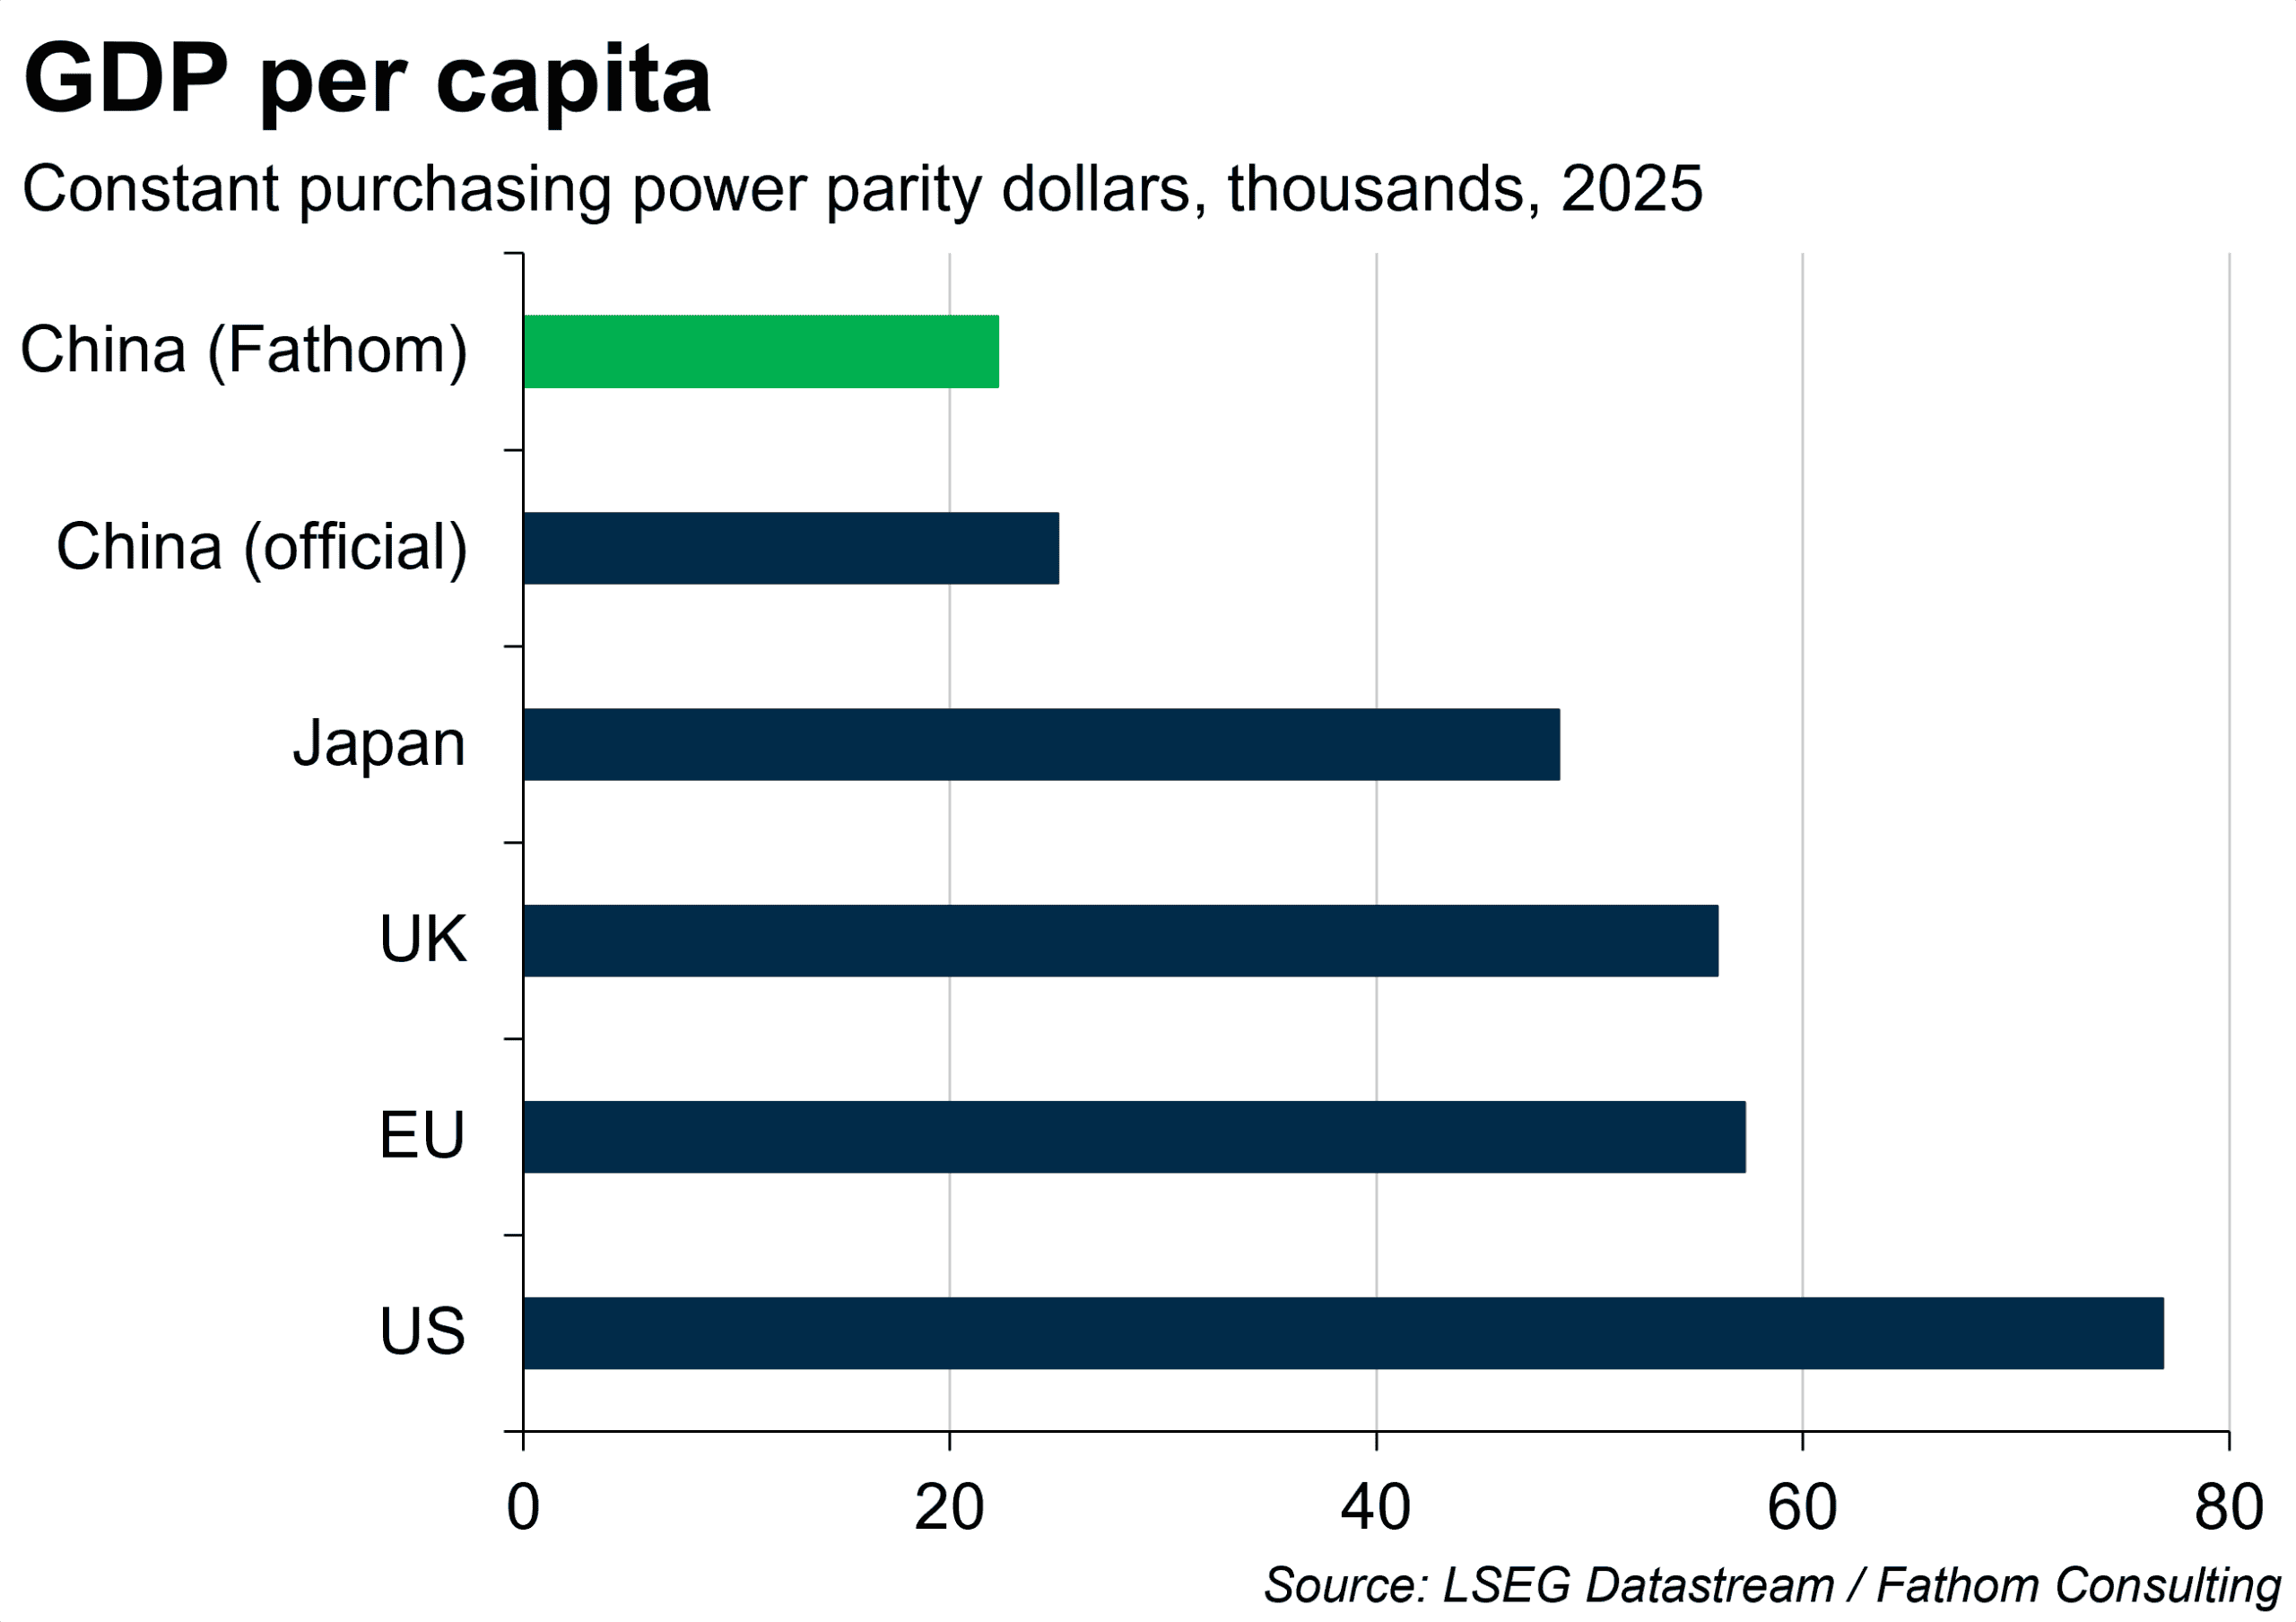
There are other anomalies: for example, how can we measure those things that contribute to activity but that aren’t transacted? Examples might be the various digital services which (at least up to now) have had a price of zero, meaning they would go unaccounted for in traditional GDP numbers.[2] In any case, while size matters, we all know its really about how you use it. Higher GDP is a means to an end. If we take that end (as I think we should) to be better welfare outcomes for the people in a given economy, the simplest and therefore most often used way to measure this is to split GDP over the population (GDP per capita). To compare welfare outcomes between countries, we also account for intra-country price differences ‒ most often by using purchasing power parity, as done below, although this relies on its own set of critiqueable assumptions. By this metric, China drops some way behind the others.
But is GDP even fit for the purpose of measuring welfare? Simon Kuznets, the originator of modern GDP accounting, was the first to say: no, it’s not. He pointed to many limitations of GDP in this respect, such as GDP only showing aggregate economy outcomes, not within-economy distributions (i.e, not capturing inequality); or that, as GDP only captures monetised exchanges, it misses out on the value added to society from things like volunteer work or unpaid domestic labour, as well as the costs imposed on it from negative externalities like environmental damage.[3]
To account for this, many alternative measures and indicators have been put forth. The United Nation’s income-adjusted human development indicators, for example, use Amartya Sen’s thinking on economic capabilities as its departure point, tracking inequality-adjusted standards of living, education, and health. Measuring welfare in this way rather than GDP per capita, the US falls from the top spot in our ranking, surpassed by the EU, Japan and the UK.
Other, more advanced indicators have also been proposed. The Genuine Progress Indicator (GPI) for example, aims to take into account environmental damages and non-monetised welfare creation, as well as inequality. In a similar vein, Kate Raworth’s “doughnut” of social and planetary boundaries contrasts welfare metrics such as life expectancy, employment and income poverty with the resources used to achieve these outcomes, and shows the degree to which that resource use is sustainable or not. Researchers at Leeds University put numbers to the concept, from which they found that over the past 30 years no country had both met the basic needs of its citizens and kept withing a globally sustainable level of resource use.[4]
Of course, criticisms abound on these alternative measures too, with one common critique being that some of the metrics these indicators include, like life satisfaction, cannot really be measured. And while, yes, it’s true that anyone who has both met a Finn and seen that Finland regularly tops indices of happiness, is going to be sceptical of the veracity of more subjective measures, this does not in turn invalidate the critiques of regular GDP; or mean that we should stop seeking other metrics for questions that GDP is not designed to answer.
So where does all this leave us? First, comparative economic analysis requires, as any economist at Fathom well knows, vigilance in the selection of which GDP measure to use, as it is by clearly defining the question at hand that we can choose which instrument is best to answer it. But we should also keep in mind, and emphasise more than we do today, that GDP is not the tool to answer all questions. Other indicators exist, but they are neither calculated as often nor receive anywhere near as much attention as traditional GDP. As our societies grapple with questions of inequality, climate change and political divide, it’s time to seriously review our economic toolbox and expand it to the tasks at hand, explicitly and not just tacitly admitting that GDP is not a one-size-fits-all solution.
Further reading and listening
China’s industrial policies, a help or hindrance?
Global Outlook, Summer 2026: preview
Lessons from the Bank of England
[1] For example, GDP in Ireland rose 8% from 2024 to 2025, GNI* on the other hand rose by a ‘mere’ 4.7%.
[2] Brynjolfsson, Collis, Diewert, Eggers & Fox (2025) attempt to correct for this in their measure of GDP-B, where B stands for ‘benefit’, GDP-B: Accounting for the Value of New and Free Goods – American Economic Association
[3] Green GDP, which you can read more about here https://www.fathom-consulting.com/climate-keynes/ reflects efforts to better incorporate natural capital in traditional GDP.
[4] https://goodlife.leeds.ac.uk/