A sideways look at economics
Intelligence tests are wrong. Let me count the ways.
They are morally wrong because they result in people being placed in categories and treated differently because of that. This categorisation is a lazy shortcut that assumes there is some degree of stickiness about which category you belong to — it’s easy to put people in boxes and forget that they are people. Easy, but wrong, every time.
They are intellectually wrong because they assume that intelligence can be mapped on to a single dimension as though people are ‘more’ or ‘less’ intelligent in some meaningful, catch-all way. This is fundamentally untrue in my experience. Some people that I know well are, for example, very quick on the uptake, but rather shallow: prone to make snap judgements (which are often accurate), but unlikely to think deeply about an issue. They like to skate lightly across the surface of things and are very good at doing that. But they don’t like delving into the depths.
Others dwell in the depths and rarely surface for more than a few minutes at a time. They think slowly and express themselves laconically. One friend of mine, a retired professor of mathematics, is like that — he occasionally indulges in light conversation but pretty soon you can see his mind returning to its natural habitat, the deep waters of number theory.
Which of these types is more intelligent? The question doesn’t mean anything: it would be like asking “Which of blue and red is more colourful?” And those are only two types. In fact there are many ‘types’ — so many that the idea of a ‘type’ is itself offensive. There are as many types, as many categories, as there are individuals.
Intelligence tests are wrongly described because their aim isn’t really measuring intelligence at all, but something closer to: how good are you at picking the answer that most people would pick? That is a kind of intelligence — a sensitivity to the predilections of the majority. But it’s not the only kind.
For example, many so-called IQ tests have questions that give you the first few numbers, characters or patterns in a sequence, and you are asked to identify the next one. In fact, formally, the next number in the sequence is not determined. It could be any number.
That is not what you are being asked, though — you are being asked: what number would most people pick?
Similarly, the next in the sequence: Blue, red, blue, red, blue, … could be ‘red’. Or it could be ‘dolphin’. Or it could be ‘antidisestablishmentarianism’. Or any other word. Or indeed it could be ‘19’. Or ‘#’. One could, if one could be bothered, define a rule that made sense of all those choices. ‘Red’ is just the one most people would choose. There is a kind of Occam’s razor in play here — a presumption that the simplest sequence is generally the right one. But, again, Occam’s razor is really a description of the preferences of most people rather than a description of the world. There is absolutely no reason to believe that the simplest explanation is most often the right one. It’s just that most of us prefer simple explanations.
For some, the question “What is the number that most people would pick?” is relatively easy. For others, extremely difficult. Who is more intelligent? Again, the question is meaningless. Both have their value — the first kind of intelligence is characteristic of some successful traders in financial markets, who have a very keen sense for what the average trader thinks the average trader is thinking (to paraphrase Keynes). The second kind is the kind that dislodges the received wisdom, creating change.
Which brings me to the point of today’s blog. What’s next in this sequence?
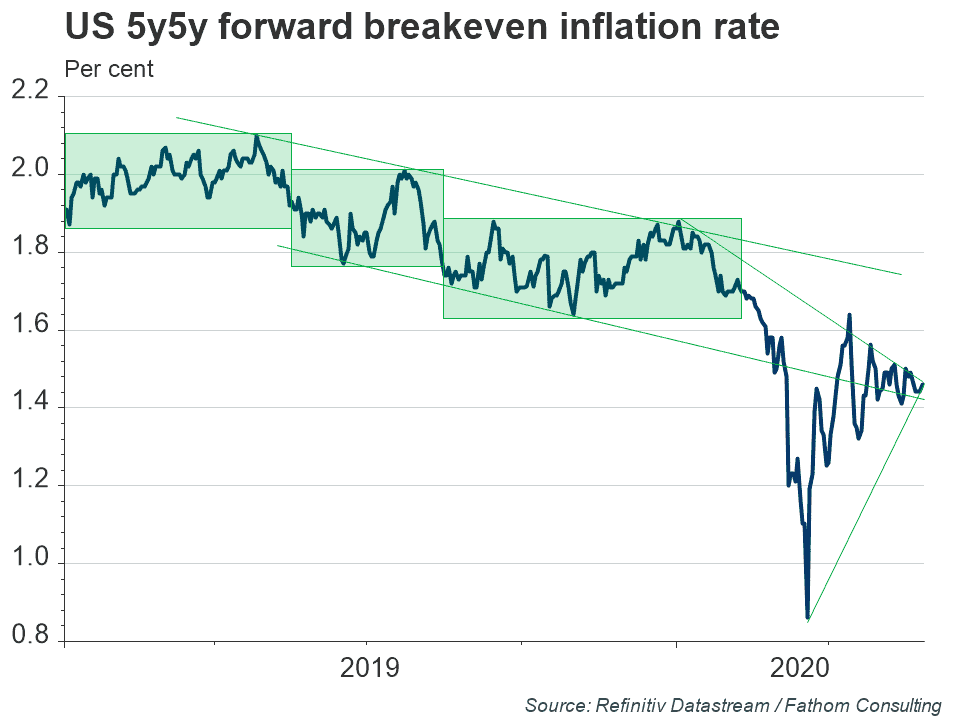
The concept captured in the chart above is exceptionally important for the outlook for the economy and for the stance of policy. The line is what bond markets expect inflation to average between five and ten years hence in the US.
There are so many problems with that statement that I hardly know where to start.
First, the line (a favourite of Alan Greenspan’s when he was the Fed chair) is the difference between the yield on a nominal government bond and an index-linked government bond. That difference must reflect expected inflation over that period, right? So, an index-linked bond might yield 2% plus whatever inflation turns out to be over the coming year, while a conventional (nominal) bond might yield 4%. So, the market must be expecting 2% inflation, right? Well, not exactly.
Breakeven inflation rates, derived by comparing the yields on conventional and index-linked bonds, aren’t the same as the average rates of inflation expected by investors for a whole host of reasons, including the existence of an inflation risk premium, but let’s pretend for a moment that they are, else we’ll be here all day.
There is a great deal of complexity buried in each one of the points in the line on the chart. Take another look at it. What happens next?
The way Fathom and other macro outfits would typically address this question would be by invoking some kind of model, perhaps of adaptive expectations, that starts from the assumption that the line is more or less an accurate measure of inflation expectations, in spite of all the issues sketched out above. So:
E[inflation] = f(lagged inflation, inflation target, E[aggregate demand, aggregate supply], expectations shocks) (1)
So if I believe that macro policy will move to ensure that aggregate demand equals aggregate supply in expectation, then I would expect inflation gradually to converge towards the inflation target, absent any shocks to expectations (which most economists would set at zero). The fact that bond markets appear to be expecting inflation to fall short of the target between five and ten years ahead suggests that, if that model is correct, they also expect aggregate demand to fall short of aggregate supply at that horizon. In other words, if that model is right, markets believe that policymakers have not yet done enough to support demand in the medium term. Fathom’s view is that markets are wrong on that score, because the current crisis has done more damage to aggregate supply than markets currently believe. Fathom argues that inflation will turn out higher than markets currently expect.
However, that model might not be correct. The line in the chart is intended to be an expectation, a forecast, if you like: the implied market forecast of inflation. What kind of intelligence is driving that forecast? Is it the kind of intelligence that searches for fundamental drivers? Or is it the kind that is highly sensitive to what other market participants might be thinking?
Some commentators would look at a chart like that and would make inferences about the future that are based purely on the properties of the chart itself, completely independent of whatever it is that the line on the chart is supposed to be capturing. So-called ‘technical analysis’ is a way of doing this, involving (to my jaded, macroeconomist’s eye) drawing a set of highly tendentious and randomly selected lines (I’ve put a few on the chart above) overlaying the principal line on a chart. Bad econometrics with no supporting diagnostics or significance tests. Technical analysts would probably argue that the lines and patterns they superimpose on such charts are just ways of framing their thoughts, not formal statistical devices. And further, that if lots of traders are also framing their thoughts in a similar way, there’s a good chance that any inferences they draw about the future path for the variable of interest will be borne out — because it’s only traders that determine those outcomes.
Something similar is true for inflation expectations. Expectations of inflation are important drivers of actual inflation, and vice versa. If the world believes inflation will be x, then there is a good chance that it will be x at least for a while, because that belief is a big part of what drives inflation, even in the macroeconomist’s model. That model basically goes:
Inflation = expected inflation + price shocks (2)
where expected inflation is probably driven as in equation (1) above. A sceptic might argue that shocks to aggregate supply or indeed the level of aggregate supply in expectation are unobservable and fundamentally unknowable. If that were the case, then we can’t reasonably expect anything in terms of the deviation between aggregate demand and aggregate supply in equation (1) determining expected inflation. Then all we would have is a tendency for inflation to converge on its target in expectation — a tendency that will be influenced by the credibility of the monetary authority. If that credibility were low or zero, then we get:
inflation = f(lagged inflation + expectations shocks) + price shocks (3)
Then, if that’s the case, a negative shock to expectations will drive inflation down, and in the next period will consolidate the lower expectation — with nothing to ‘anchor’ inflation expectations they will shift down permanently (or at least until a positive shock occurs).
Which is all a complicated way of saying that shifts in expectations can become self-fulfilling. The kind of intelligence that is sensitive to how expectations have shifted is then more useful than the kind of intelligence that delves into the deep structure of the inflationary process, when we’re trying to judge what comes next in the sequence. With expectations, what most people think will come next is probably what will come next.
Economists are constantly engaged in this kind of battle — making assertions about economic fundamentals against a constant challenge from those who dispute that such fundamentals even exist. Which side is more intelligent? Neither, of course: these are different kinds of intelligence. At Fathom we do our best to employ both kinds. We tend to believe that the fundamentals will win in the long run. But the long run is of limited interest to many of our clients, so we need to bring our intelligence to bear on the short run as well, where a different kind of intelligence will apply.
Oh, and don’t get me started on ‘personality tests’…