A sideways look at economics
Sunday marks the anniversary of St Patrick’s death, the foremost patron saint of Ireland, now better known as St Patrick’s Day. While some still use the occasion to commemorate the missionary St Patrick and the arrival of Christianity in Ireland, it has become a celebration of Irish culture and heritage. The holiday’s popularity has spread far past the Emerald Isle and even beyond the Earth — St Patrick’s Day is also celebrated on the International Space Station. It’s not just the popularity of Irishness that has grown enormously over the years, so has the Irish economy.
The following chart shows how GDP per capita as a share of that of the US changed between 1980 and 2017 across advanced and developing economies. It’s a measure of how income levels in countries performed relative to that of the US over the last four decades or so. The income level of a country that is placed exactly on the 45-degree line has stayed constant as a share of the income level of the US over that period. Income growth in a country positioned above the 45-degree line has exceeded that of the US over the same time period, and vice versa for countries below the 45-degree line.
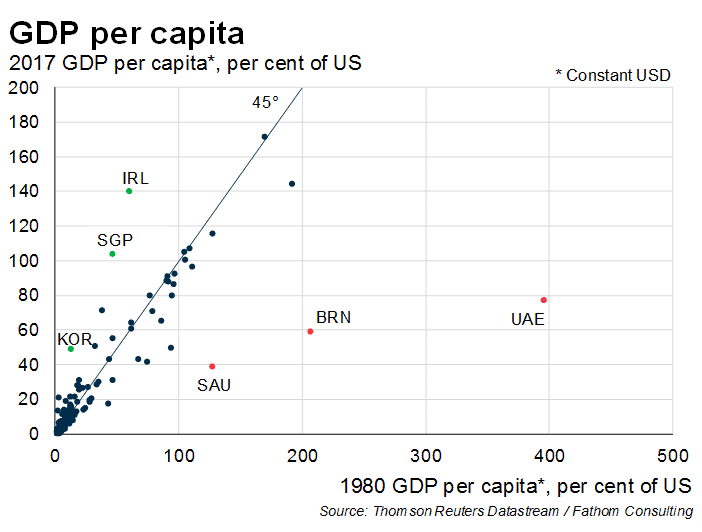
Per capita income in oil-exporting countries Saudi Arabia, Brunei and United Arab Emirates (UAE) has fallen the most compared to that of the US. Indeed, in 1980, the average person living in the UAE was four times richer than the average person living in the US. In 2017, GDP per capita was 25% higher in the US than in the UAE. But that’s a topic for a different TFiF.
The biggest success story isn’t Singapore or South Korea — impressive growth stories themselves — but Ireland. In 1980, Ireland’s GDP per capita was 60 per cent of that of the US. According to these statistics, by 2017 the average person living in Ireland was substantially richer than the average person living in the US.
Careful now.
While technically correct, the Irish GDP data are misleading. According to official data, the Irish economy grew by a quarter in 2015 alone! We have written about the shortfalls of Irish statistics before, and even produced our own gauge of Irish economic growth.[1] Our measure suggests that by the onset of the financial crisis Ireland had reached the same income level as the US. Since then, it has lost ground to the US.
By the same token, the picture would change if you take the starting base into account, i.e. apply a logarithmic scale. In relative terms, China’s per capita GDP increase from just over 1% of US GDP per capita to 15% is a lot more impressive than the magnitude of Ireland’s catch-up. As Father Ted Crilly would say: “The Chinese, a great bunch of lads.”
Similarly, the choice of the exchange rate makes a difference, too. The chart above is based on market exchange rates. But even when using exchange rates based on Purchasing Power Parity Ireland’s catch-up process would still be remarkable, second only to that of Singapore.
These factors notwithstanding, it’s undeniable that Ireland’s economic performance since the 1980s has been more than just grand. This extraordinary period of economic growth, often called the ‘Celtic Tiger’ years, has had nothing to do with Irish luck. Instead, Ireland’s economy started sucking diesel after a progressive lowering of the corporation tax (by far the most significant of these was the extension of a 10% rate to cover financial services in 1987) and personal tax rate.
Lower corporation taxes lured in high-tech manufacturers, in the form of foreign direct investment, and financial services. Both attracted high-skilled labour. Cuts in the top marginal income tax rate in Ireland from 1990 onwards further encouraged immigration into Ireland. The historic net migration outflows reversed. Of course, there were many reasons for this change: the ending of the Troubles, the creation of the single market and the improvement in the economy in the round were undoubtedly strong drivers too.
Indeed, between 1990 and the onset of the financial crisis Ireland’s labour force increased by around a million people. Demographics and bringing people into paid employment that were previously outside the labour force, i.e. an increase in the participation rate, played a substantial part. Arguably, net immigration played an even bigger part. During that period around half a million people moved to Ireland. Around a third of these were Irish. Many of them were highly skilled and educated workers who had left during the financial crisis of the 1980s. The Boys and Women in Green came back home, unlocking the Celtic Tiger.
This weekend while enjoying the craic in the local Irish pub, dressed in green, with a few pints of Guinness, don’t just give in to Irish stereotypes, but raise your glass to the great Irish people and their (economic) achievements. Sláinte!
[1] https://www.fathom-consulting.com/research-notes/measuring-the-size-of-irelands-economy/. See also Lies, damn lies and Irish statistics.