A sideways look at economics
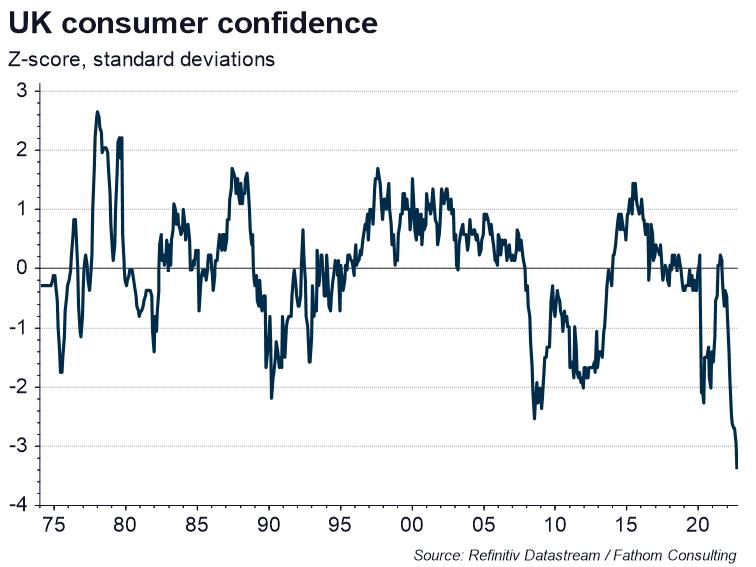
What makes people happy? I’m not looking for anything particularly profound here. I mean, what kind of macroeconomic backdrop provides people with a sense of wellbeing? With UK consumer confidence at an all-time low, the drivers of happiness seem a particularly relevant topic. Inflation is at multi-decade highs, and people tend not to like rapidly rising prices. But fixing the inflation problem is likely to mean higher interest rates, higher unemployment and falling house prices, and many people don’t like those things either. I decided to build a simple econometric model to investigate.
When I first started out as an economist in the early 1990s we used to monitor something called the ‘misery index’. It was basically the sum of the unemployment rate and inflation. The higher it went the more miserable people were – well, that was the idea anyway. So as I built my model I definitely wanted those two things on the right-hand side of my equation. I decided to add a few more variables, too, including real wages, real house prices, real equity prices, and (just for fun) the highest and the lowest rates of income tax. Next, I fitted my model to UK consumer confidence data covering the period from 1974 to 2019.[1]
The first thing to emerge was that all of my explanatory variables were statistically significant at the 10% level. What’s more, the model could account for close to 60% of the variation in consumer confidence over that period. The estimated coefficients, which capture the impact of changes in each variable on consumer confidence, are shown in my chart below.
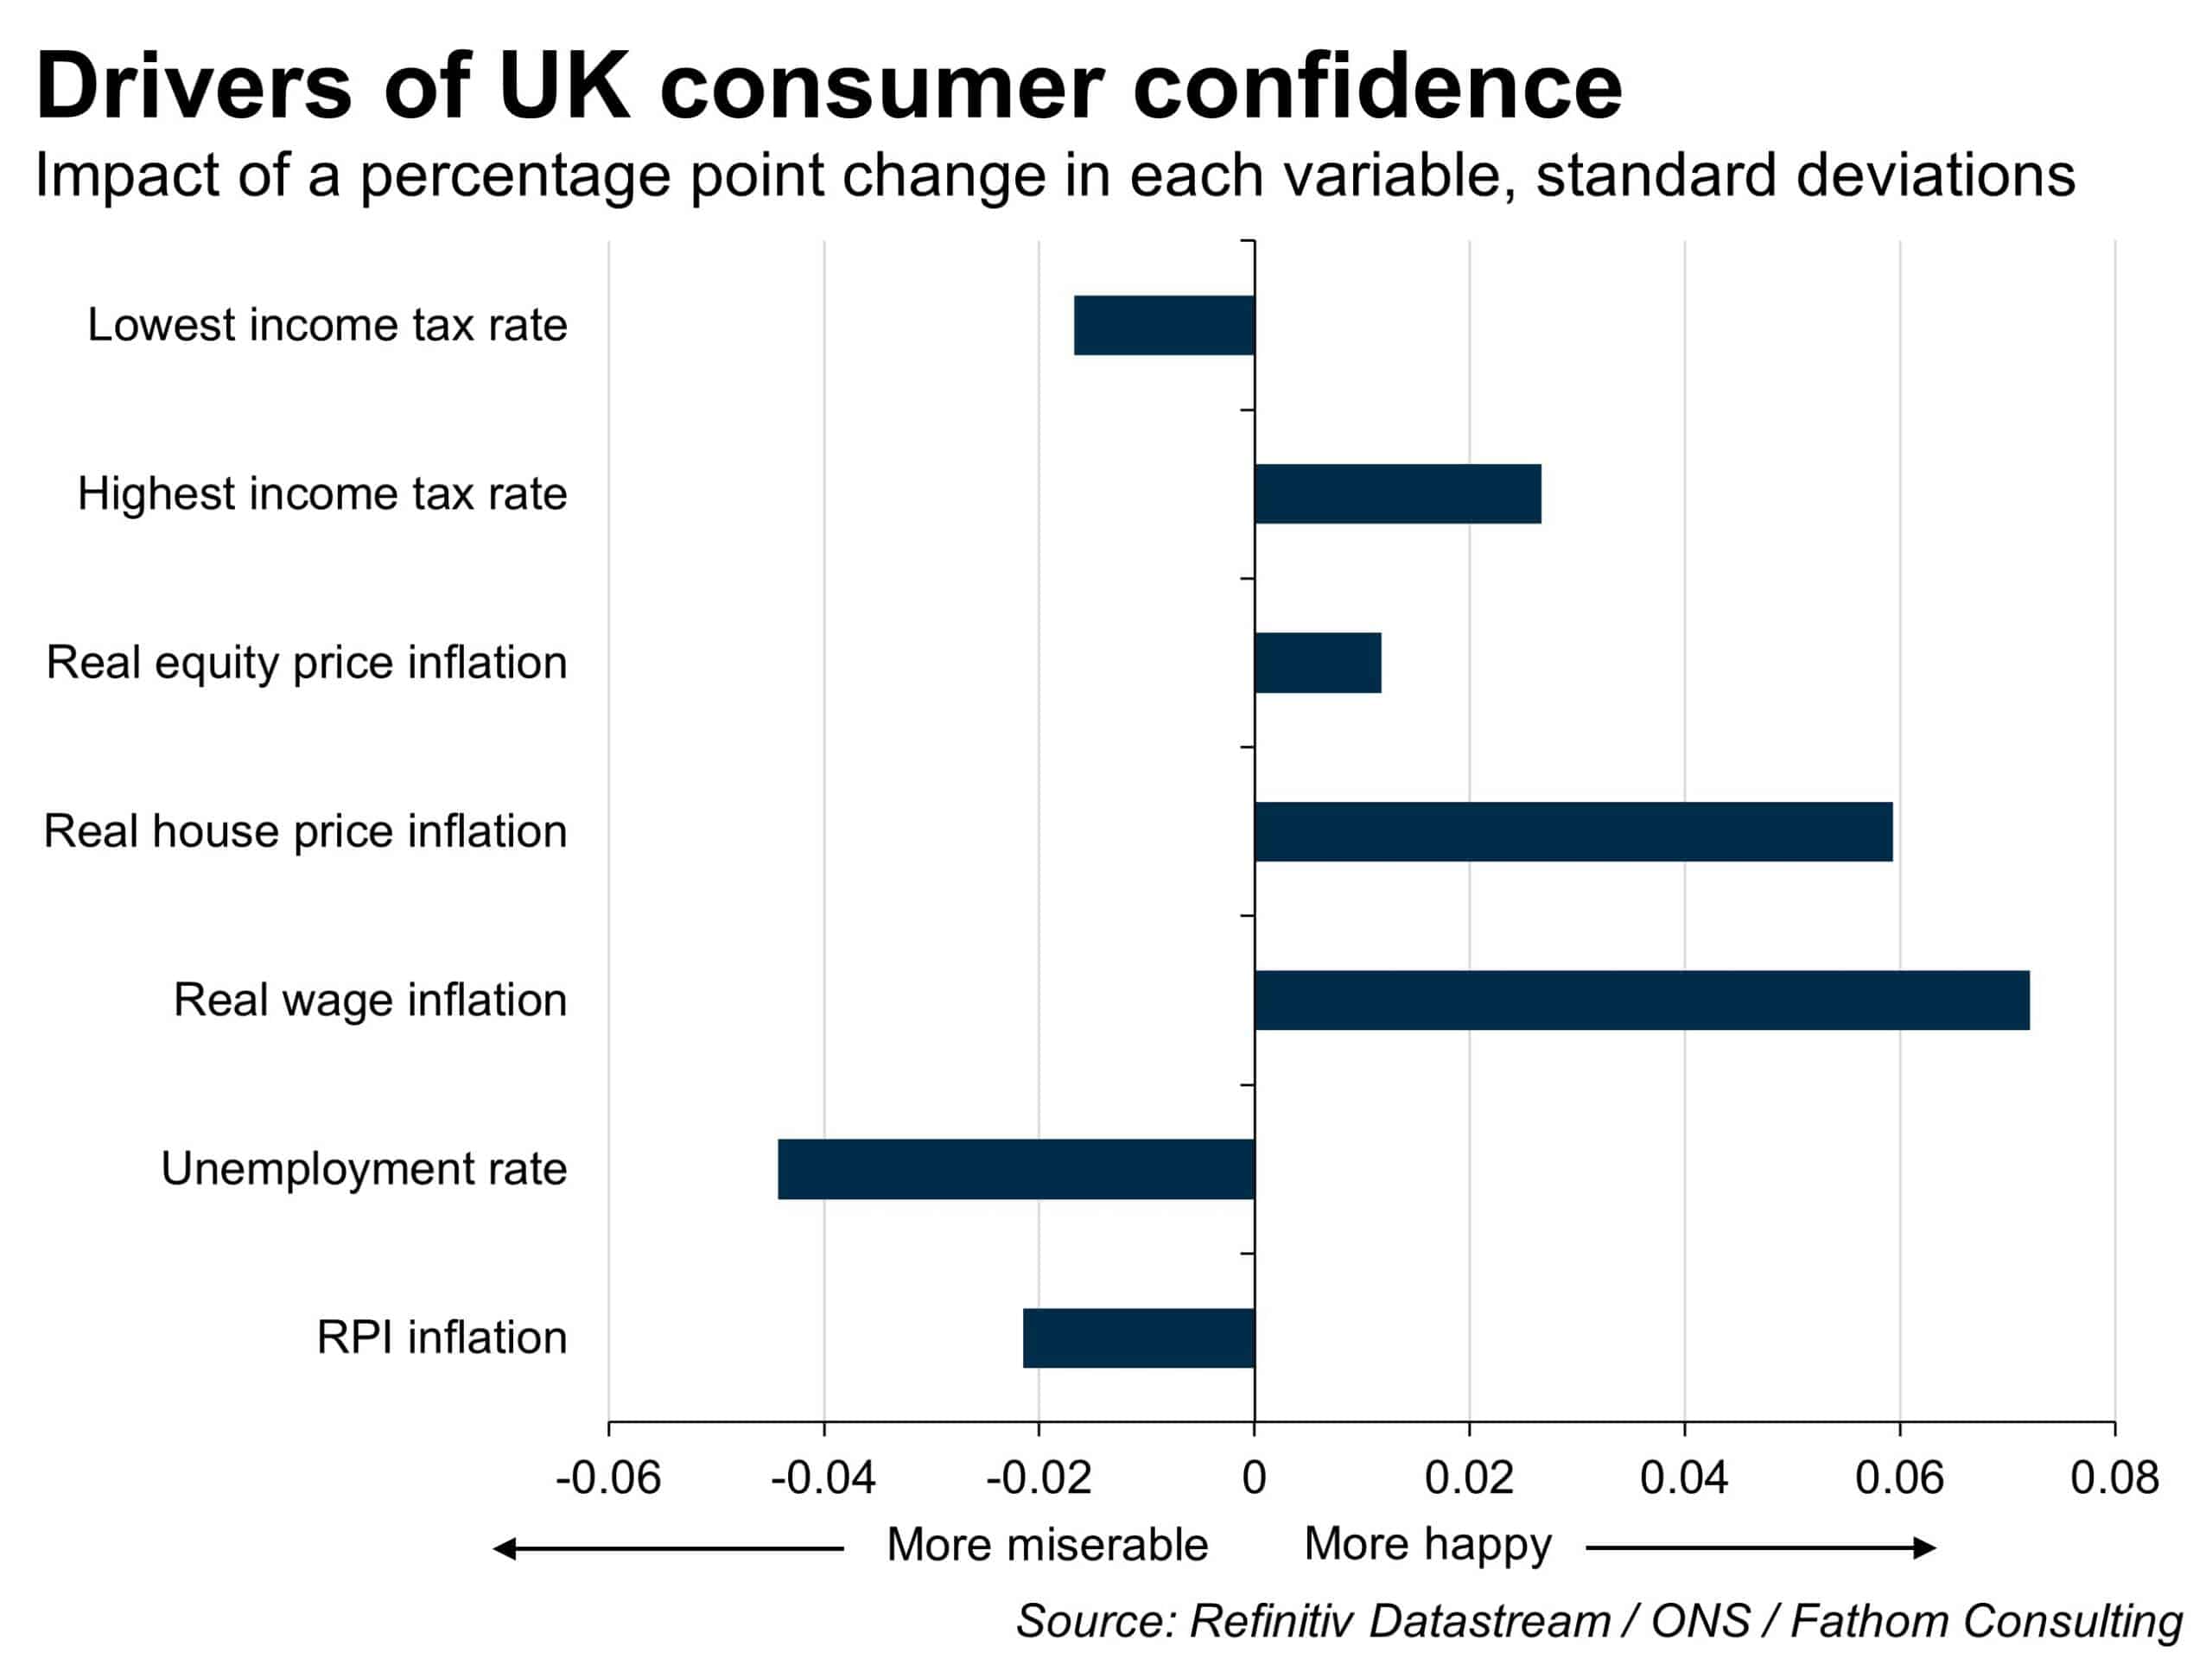
My results confirm that people don’t like either unemployment or inflation, although they appear to dislike unemployment more, with a percentage point increase in the unemployment rate more disheartening than a percentage point increase in RPI inflation — a finding which casts some doubt on the wisdom of the old ‘misery index’. On the other hand, people do like real equity price inflation, and they like real house price inflation even more.[2] They like real wage inflation best of all. Intriguingly, however, while happiness increases when the basic rate of income tax is low, people also appear, in aggregate, to like the top rate of income tax to be high. This casts further doubt, were it needed, on the political wisdom of Kwasi Kwarteng’s recent ‘fiscal event’.[3]
The fact that RPI inflation is at multi-decade highs, while real equities, real wages and real house prices are all falling, suggests we are facing something of a perfect storm on the prospects for happiness. An historically low rate of unemployment is, for now, the only bright spot. Even that is likely to change over the coming months, as Bank Rate is tightened, and activity slows still further. What is the message for policymakers from all of this? How do we make people happy again? Well, as the old saying goes, “I wouldn’t start from here”, Prime Minister.
More by this author:
When pleasantly warm becomes stiflingly hot
The art of economic forecasting
[1] The pandemic was likely to have depressed confidence through 2020, and perhaps into 2021, for reasons that would not have been captured by variables in my dataset, so I excluded that period from the model.
[2] Presumably a reflection of the fact that a majority of survey respondents are likely to be homeowners.
[3] I spent about 30 minutes building my simple econometric model late on a Thursday afternoon. I am not considering a submission to the Economic Journal – it wouldn’t make it past the front desk. It may well be that my equation is mis-specified, and that the top rate of income tax is correlated with some other, omitted variable, and that omitted variable is the true driver of consumer confidence. Nevertheless, the result was robust to several changes in model specification. It is also the case that both the top and the bottom rate of income tax move closely together through time, and yet the dataset is sufficiently rich that we can assign differently signed, yet statistically significant coefficients to each.