A sideways look at economics
As I sat in the poorly insulated shed at the bottom of my garden that I use as a home office, on Tuesday of this week — the hottest day ever recorded in the UK, when temperatures exceeded 40°C in parts of the country — I was reminded of my colleague’s blog from 24 June. Andrew (the other Andrew, not me) wrote about the perceived impact on individual levels of productivity across the company of one particularly warm Friday, when the temperature in central London had reached the dizzying heights of 31°C. There was a wide range of responses. One person felt that, in the heat, their productivity had fallen by 20%. Another suggested that their productivity had risen by 10%, citing a combination of the pleasantly warm temperatures rather than stifling heat where they happened to be, and the prospect of attending a beer festival in the evening, which gave them an added incentive to get their work done in a timely manner.
I confess that the second unnamed individual was me. As I sat sweltering on Tuesday, with my electric fan fighting a losing battle against the sun that began to stream through the windows from mid-afternoon, I reflected on what a difference those extra 10°C or so had made, to me at least. My own productivity, boosted when the temperature was a few degrees above the seasonal norm, had taken a nosedive.
Rather than trouble my colleagues with a second survey, I decided to look at the official statistics, to see if I could find any evidence of a link between exceptionally warm summers and UK economic activity.
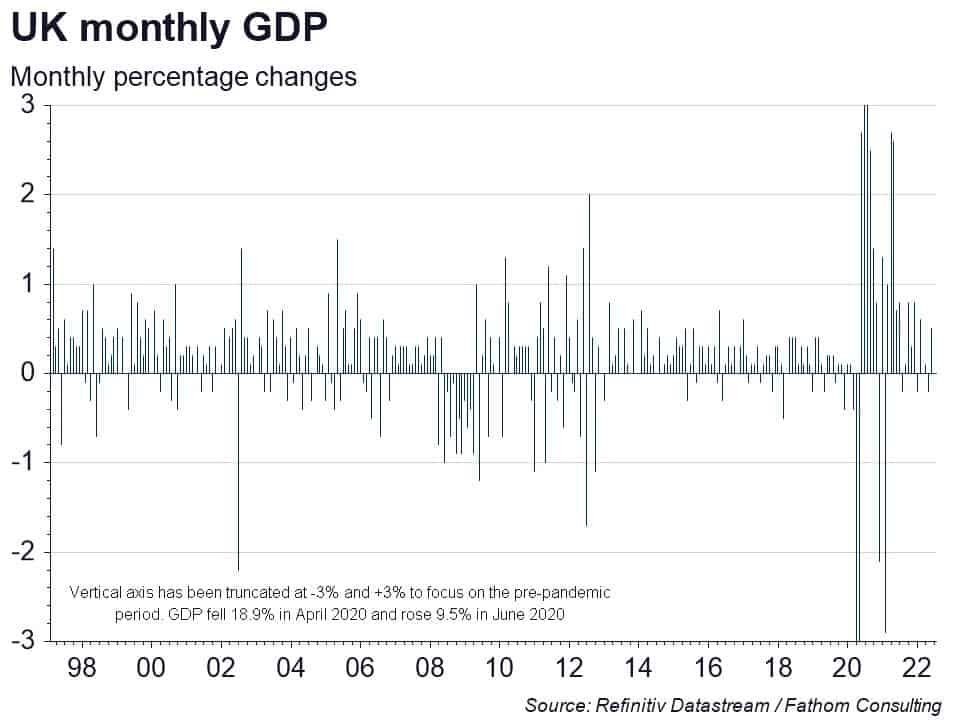
The UK Office for National Statistics (ONS) publishes a measure of monthly GDP growth stretching back to 1997. As my first chart shows, it is a volatile series with little persistence (and that was true even before the pandemic). It looks like it would be hard to model, and indeed it is. But I do find some evidence of a non-linear relationship between the temperature in July, and economic output. Specifically, growth seems to pick up a little as the average daily maximum temperature for central England rises above the seasonal norm, of around 21.5°C, to as much as 23.5°C.[1] Beyond that point, any further increases in temperature appear detrimental to economic activity, with my model implying that output would be more than 6% below normal at temperatures of 40°C.[2]
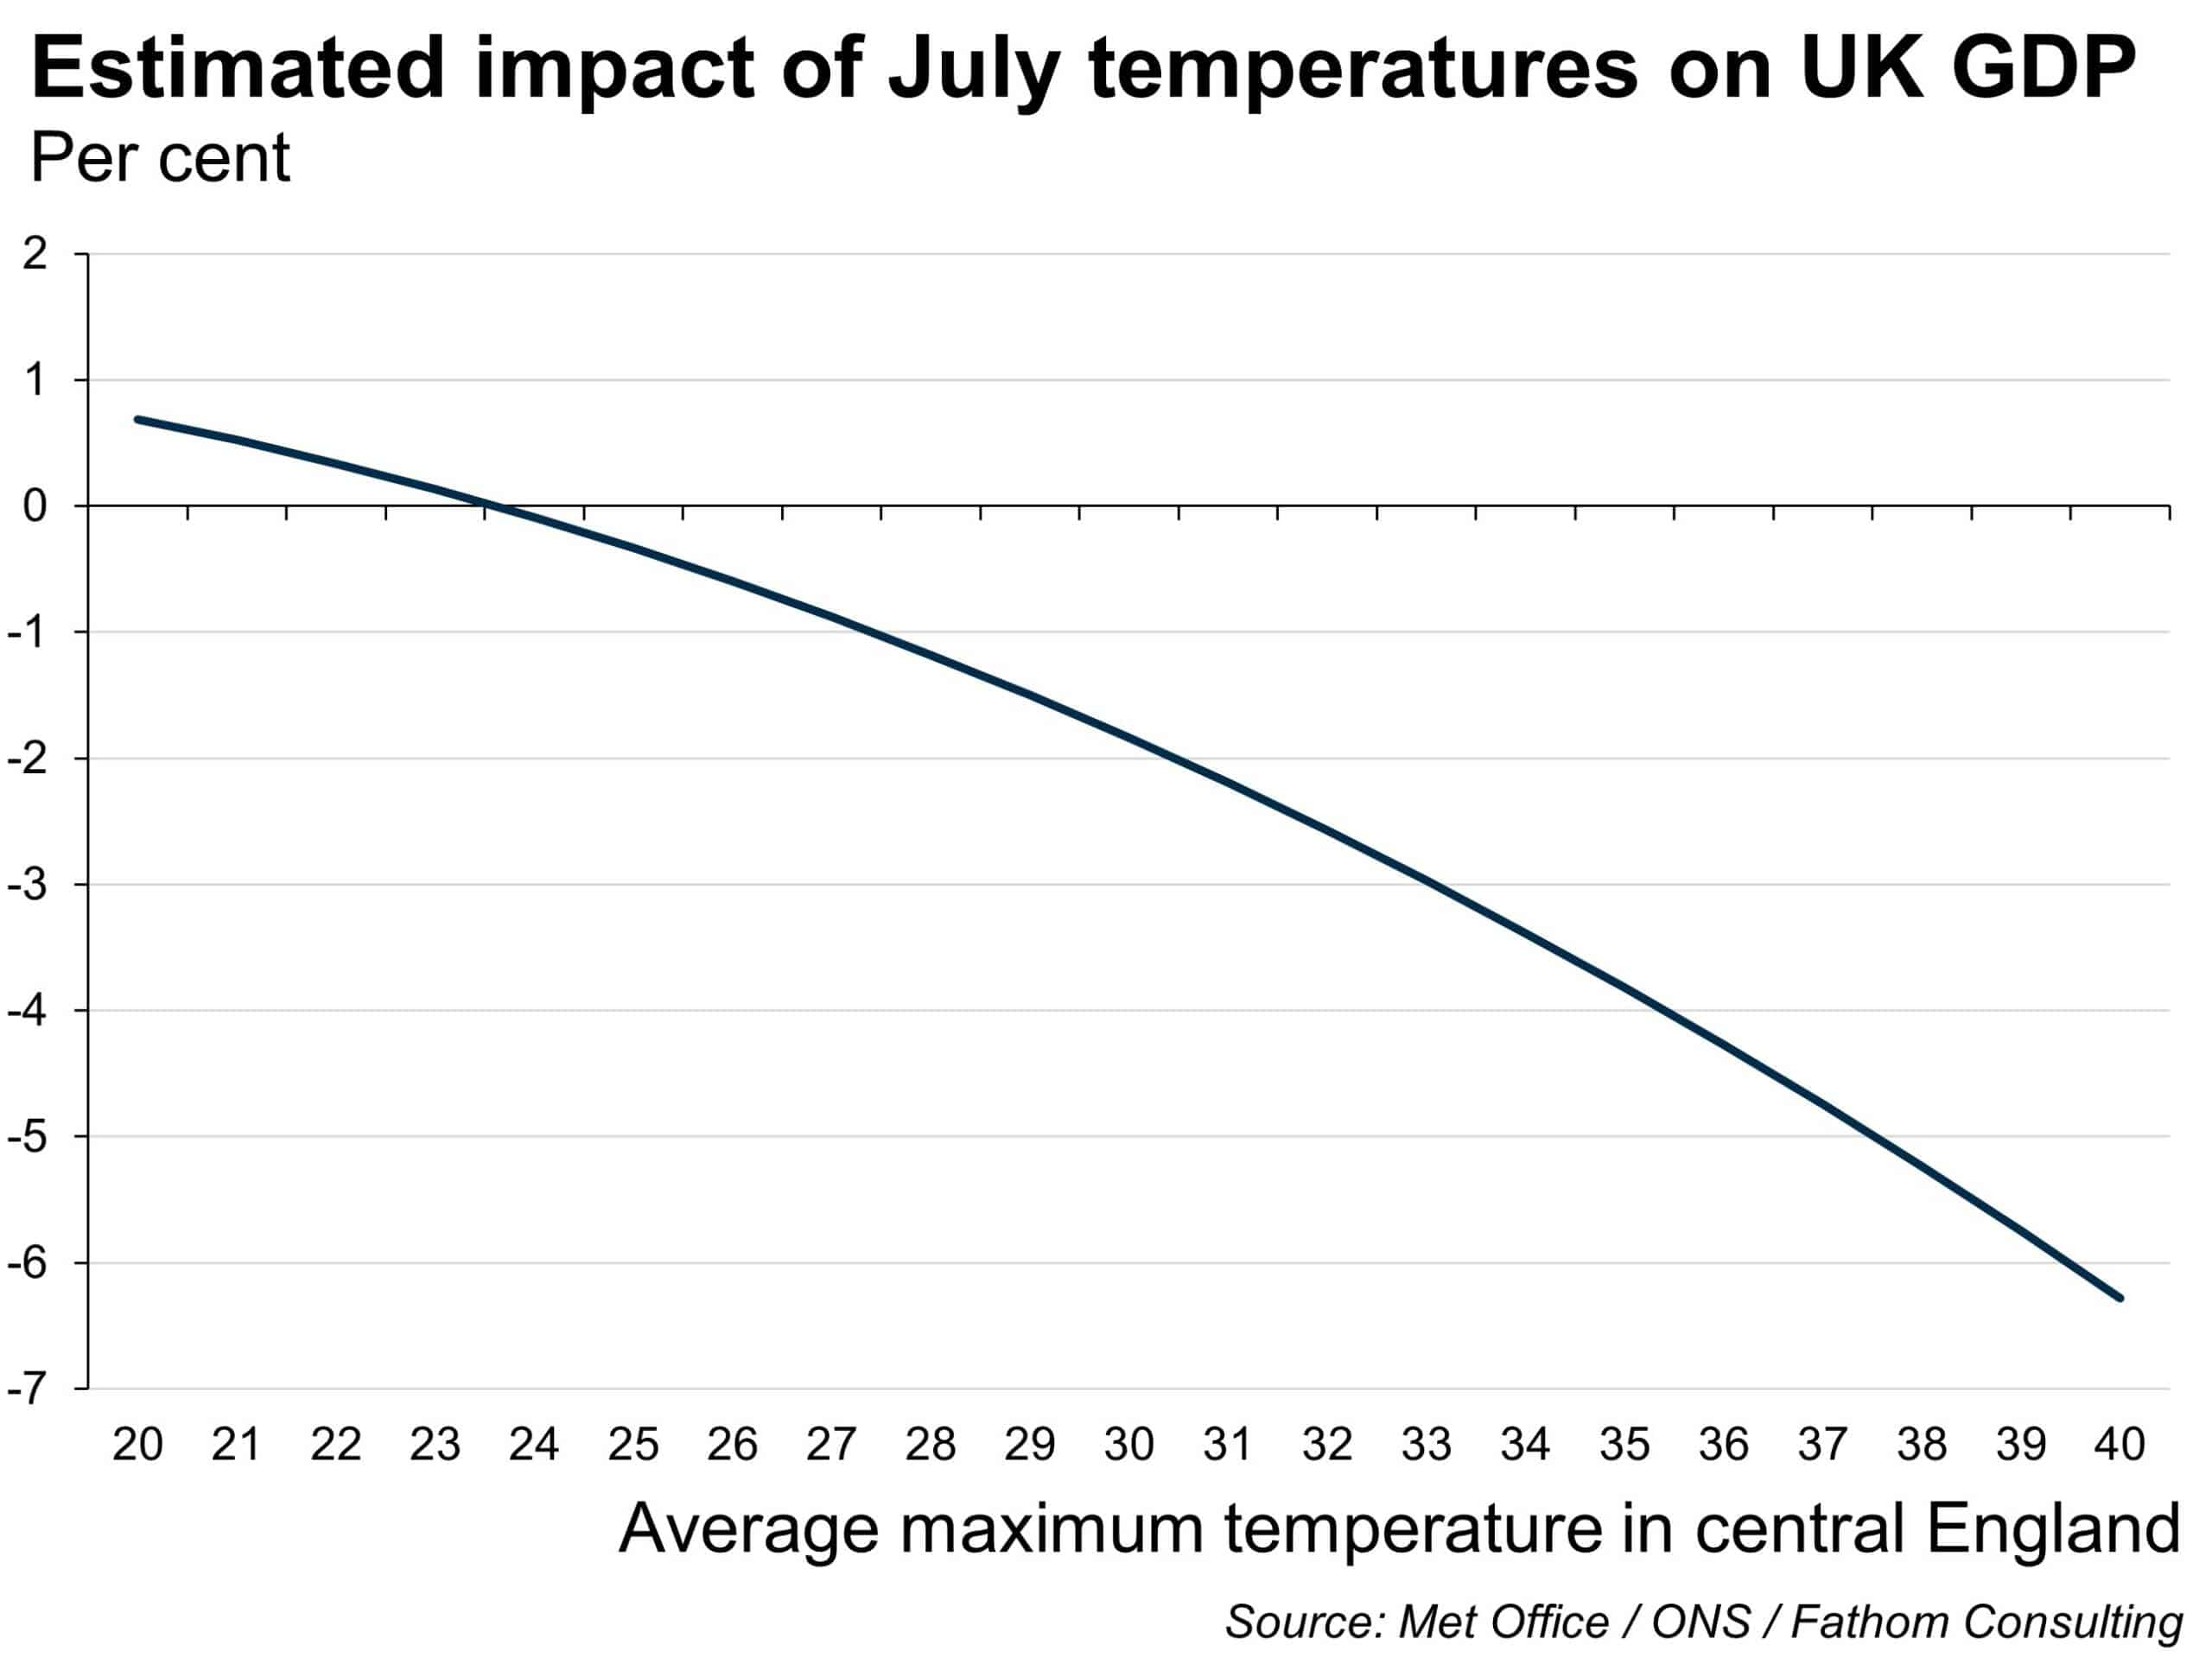
The point estimates shown in my chart should not be taken too seriously. We have insufficient data to measure accurately the shape of the curve – the results are based on just 25 observations, from July 1997 through to July 2021. Moreover, during that period the average maximum temperature for central England has varied between 19.0°C (in 2007) and 25.6°C (in 2018), though it may well go higher than that this year. Nevertheless, I feel the general shape of the curve has some intuitive appeal. Most of us enjoy a bit of sunshine. Warmer weather may even encourage us to spend more, particularly at the weekend, up to a point. But this week’s extreme heat had a different effect. I left the house just before midday to go to the supermarket. The streets were much quieter than normal. And those people who were out looked far from happy to be there.
One of the difficulties that economists face when designing policies to combat the effects of climate change is that there is so much we simply do not know. While there appears to be a degree of consensus among scientists about the impact of emissions on global warming, the consequences of a given degree of global warming on welfare, however we choose to measure that, appear much less certain. Scientists warn of substantial non-linearities, or tipping points, waiting for us around the corner. Beyond some uncertain threshold, the consequences of a further 1°C of warming are likely to be an order of magnitude different from those of the previous 1°C rise. If failing to address climate change is believed to be harmful, but to an unknown degree, then a risk-averse society should if anything take greater steps to reduce emissions than if the outcome were known with certainty. From my perspective, that makes the relatively slow progress to date puzzling. It may simply be that, in aggregate, we discount the future too highly to act.
The record temperatures experienced in the UK this week remind us that global warming is not just about the mean, it’s about the standard deviation. It’s about extremes of temperature, in other words. While the Intergovernmental Panel on Climate Change talks of the steps that must be taken to keep the increase in the global mean temperature over the past 150 years or so to 1.7°C, according to Met Office data the maximum temperature observed in central England has risen by 5.8°C in the past 50 years, and by 3.9°C in the past 3 years alone.
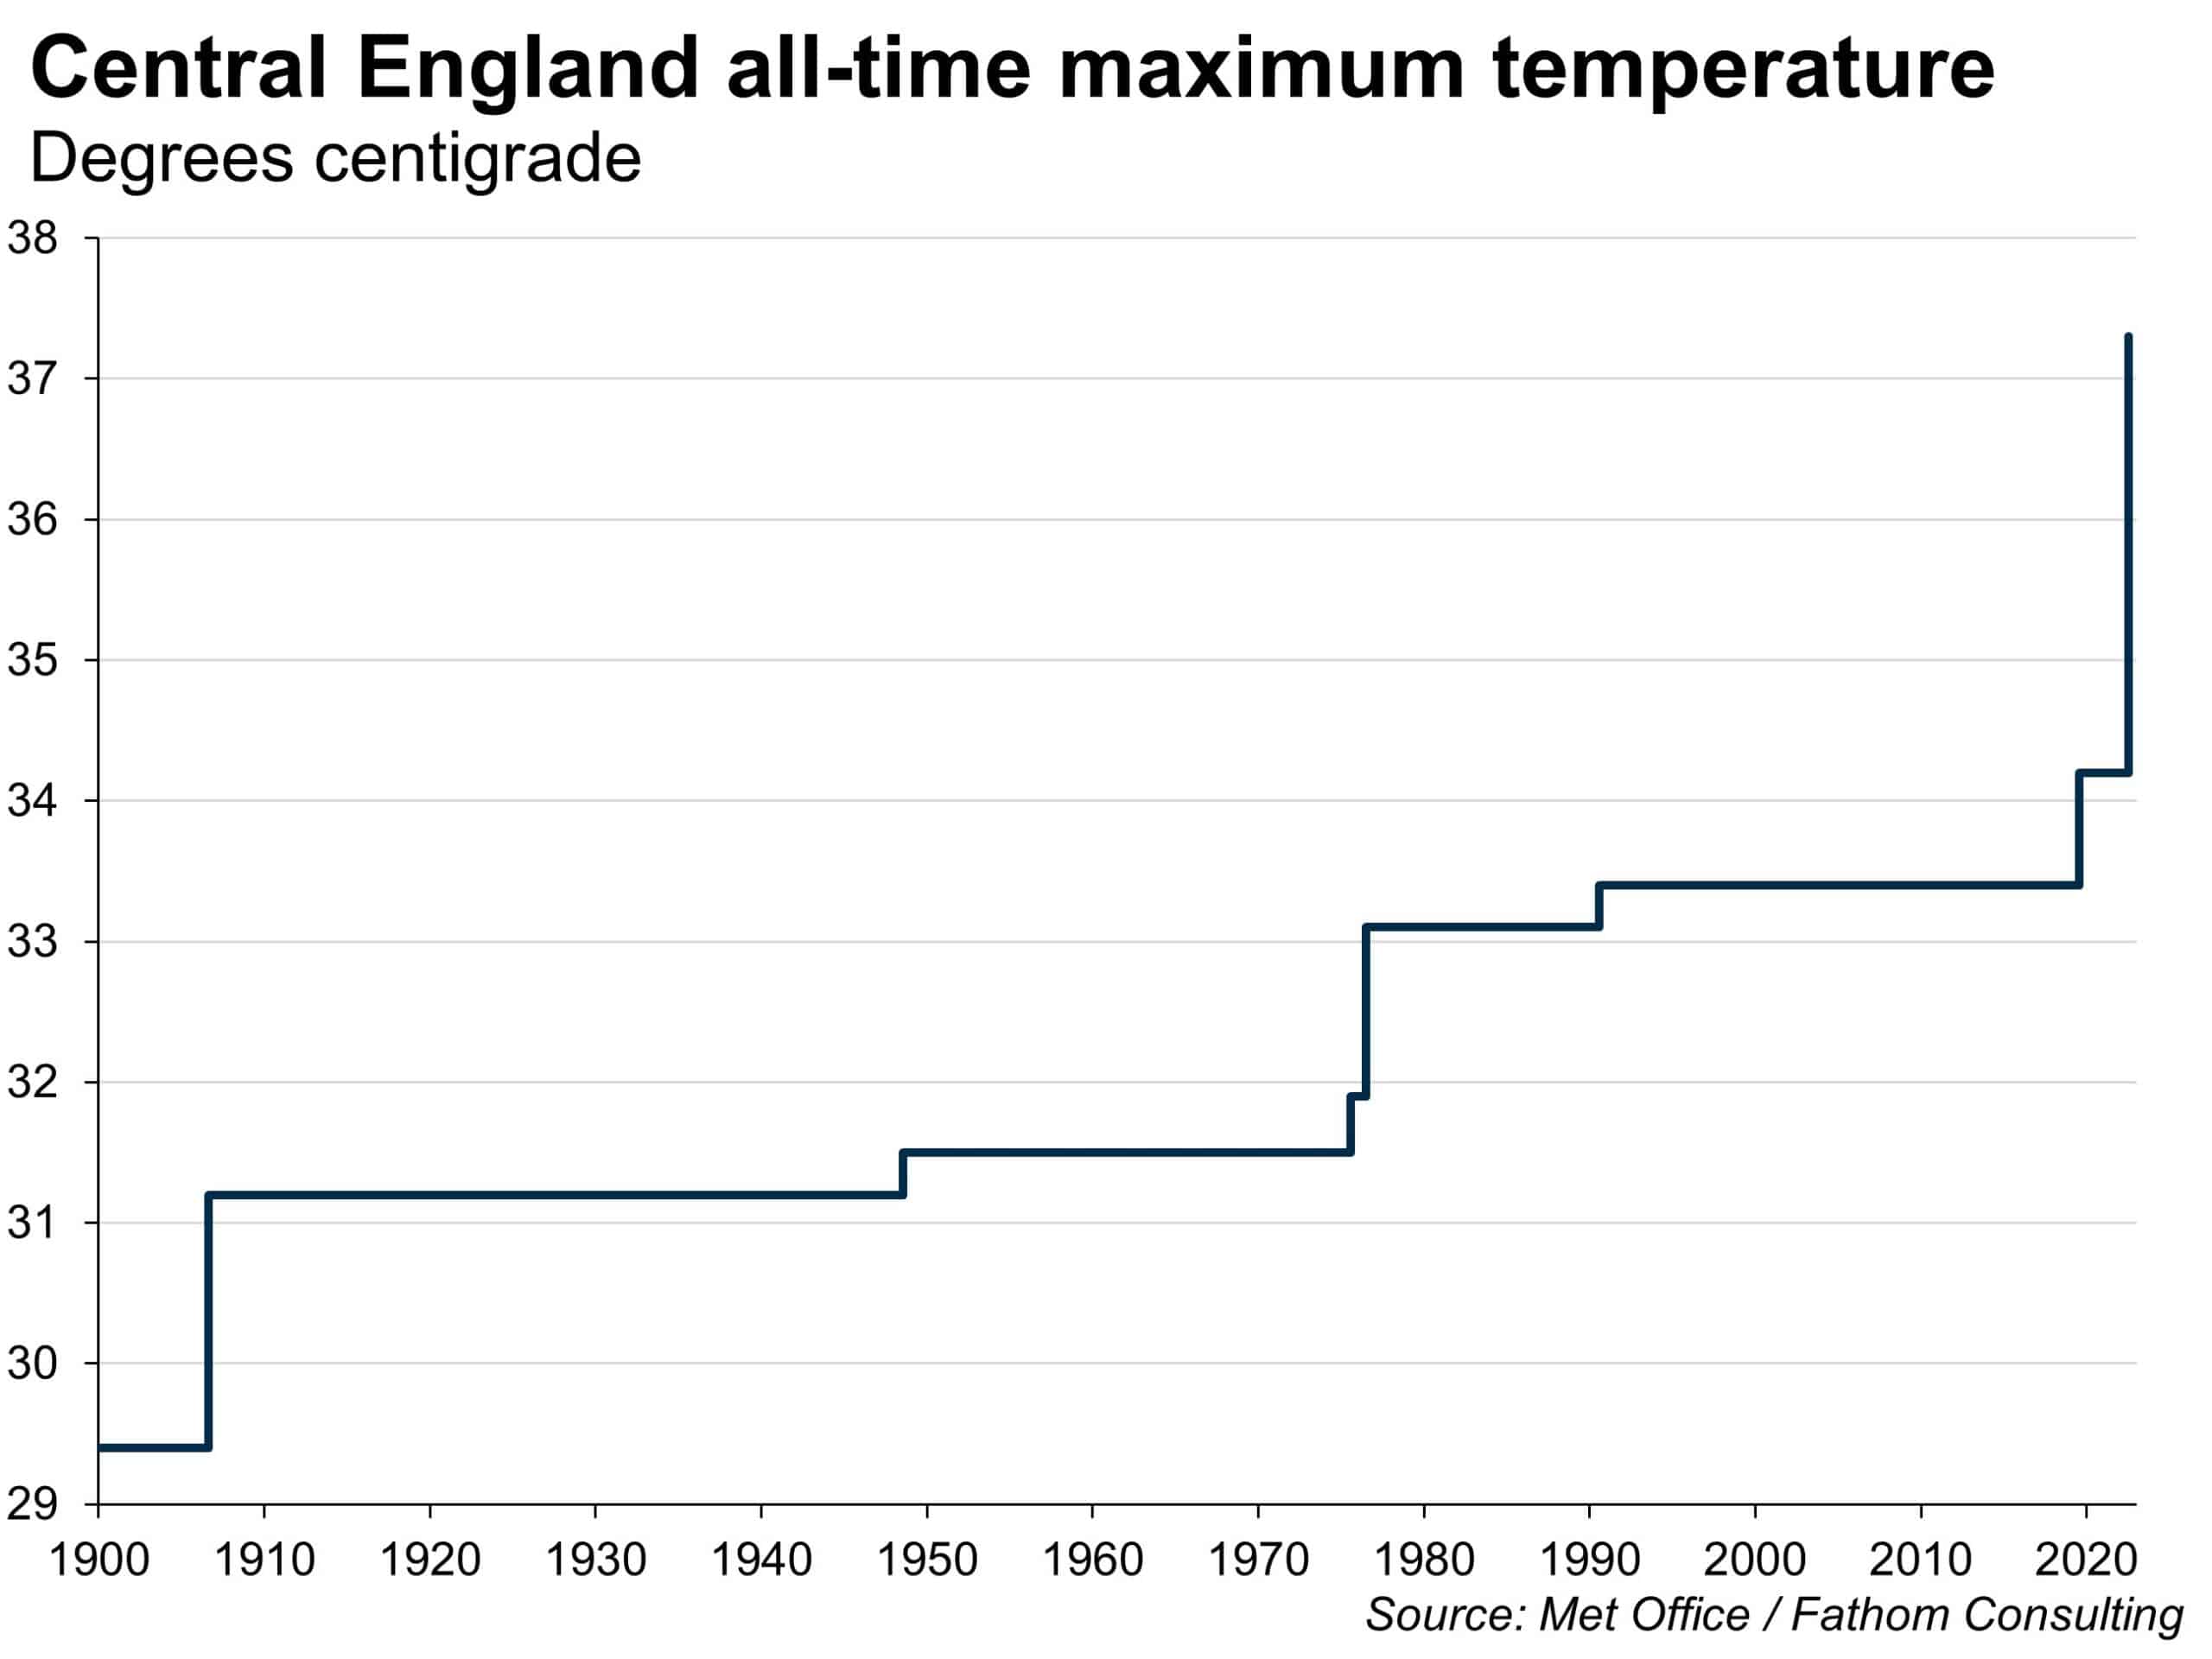
For some in the UK, these weather events will have brought the consequences of climate change to the fore once again. One national tabloid ran with the headline ‘Sunny day snowflake Britain had a meltdown’ after temperatures reached 34.8°C in central England on Monday, only to switch to ‘Nightmare of the wildfires’ as temperature records were broken for the second day in a row on Tuesday. Just one more non-linearity, perhaps.
[1] My temperature data are based on the daily maximum temperature recorded by the Met Office for central England, which it defines as a ‘roughly triangular area of the UK enclosed by Lancashire, London and Bristol’.
[2] For what it’s worth, I suspect my own productivity was far more than 6% below normal on Tuesday of this week.
More by this author