A sideways look at economics
In Stephen Leacock’s short story ‘Q: a psychic pstory of the psupernatural’, a character called Annerly reports that an acquaintance he refers to as ‘Q’ experienced the following manifestation of his dog:
“Well, then, the projection, or phanogram, of the dog passed in front of them so plainly that Miss M swore that she could have believed that it was the dog himself. Opposite the house the phantasm stopped for a moment and wagged its tail. Then it passed on, and quite suddenly disappeared around the corner of a stone wall, as if hidden by the bricks.”
We at Fathom are in the business of making projections, among other things. The business of forecasting is often compared to astrology or gazing into crystal balls; trying to see the shadowy future through some magical process combining arcane models and shamanic rituals of reading the signs. Long ago when I worked at the Bank of England, I lived in a part of London called Stoke Newington, which was at that time just becoming trendy. It had a strong hippy vibe: lots of earnest people seeking self-knowledge and all the rest. I visited the local bookshop in search of an economics text I needed for work. Not seeing an economics section, I went to the counter and asked the person there if such a thing existed. She looked at me, horrified, and said: “Economics? Good lord no! People around here are more into therapy and healing. But you might find something under ‘Religion and the Occult’.”
The truth about economic forecasting is much more mundane. For the most part, it involves trying to see what is actually happening now as clearly as possible. Any forecaster can reliably improve their forecast accuracy by spending more time looking at the current data, the more timely the better. When you see comparisons of forecast accuracy, that is mostly what is being measured: how recently the forecast was updated, and how much attention the forecaster paid to the data.
I suppose the same is true for users of crystal balls: the most convincing are those who pay the closest attention to the person actually in front of them.
Looking into the crystal ball
The phantasm of the dog in Leacock’s story didn’t just look like the dog: it was the dog. When it disappeared around the corner, it was not as if hidden by the bricks, it was actually hidden by the bricks. But the writer’s breathless tone, the sense of something extraordinary and occult happening and the use of special signifiers (‘Q’, ‘M’ and so on), all of these lead the reader into a credulous frame of mind. A frame of mind that is ready to see magic where there is none.
Economic forecasters also play these games. Some are self-styled ‘gurus’, claiming some special insight into the future that is not available to regular people. Others claim a special relationship with their own favourite economic gods, such as the monetary aggregates: if only we would all consult the high priests of monetarism with the proper mix of respect and obeisance, then we would see those parts of the truth that they feel we are able to comprehend. Some employ models of astonishing complexity involving concepts far removed from normal life. The Bank of England’s now defunct dynamic stochastic general equilibrium model BEQM, the Bank of England Quarterly Model, was built around ‘deep structural parameters’ (courtesy of the late Nobel prize-winner Robert Lucas) such as the ‘coefficient of relative risk aversion’. Parameters like these were supposed to give a deeper insight into what drives the choices made by ‘the representative consumer’. I’ve never met a representative consumer, and if I were to ask myself, a professional economist, what my own coefficient of relative risk aversion might be, I would not have the first idea how to answer.
BEQM was a hopeless tool for forecasting as it took three months for a team of economists to update it. That meant the new forecast started production the moment the last one was published, so it was necessarily detached from the most recent data, and therefore was typically less accurate than forecasts produced by people who just looked carefully at what was in front of them.
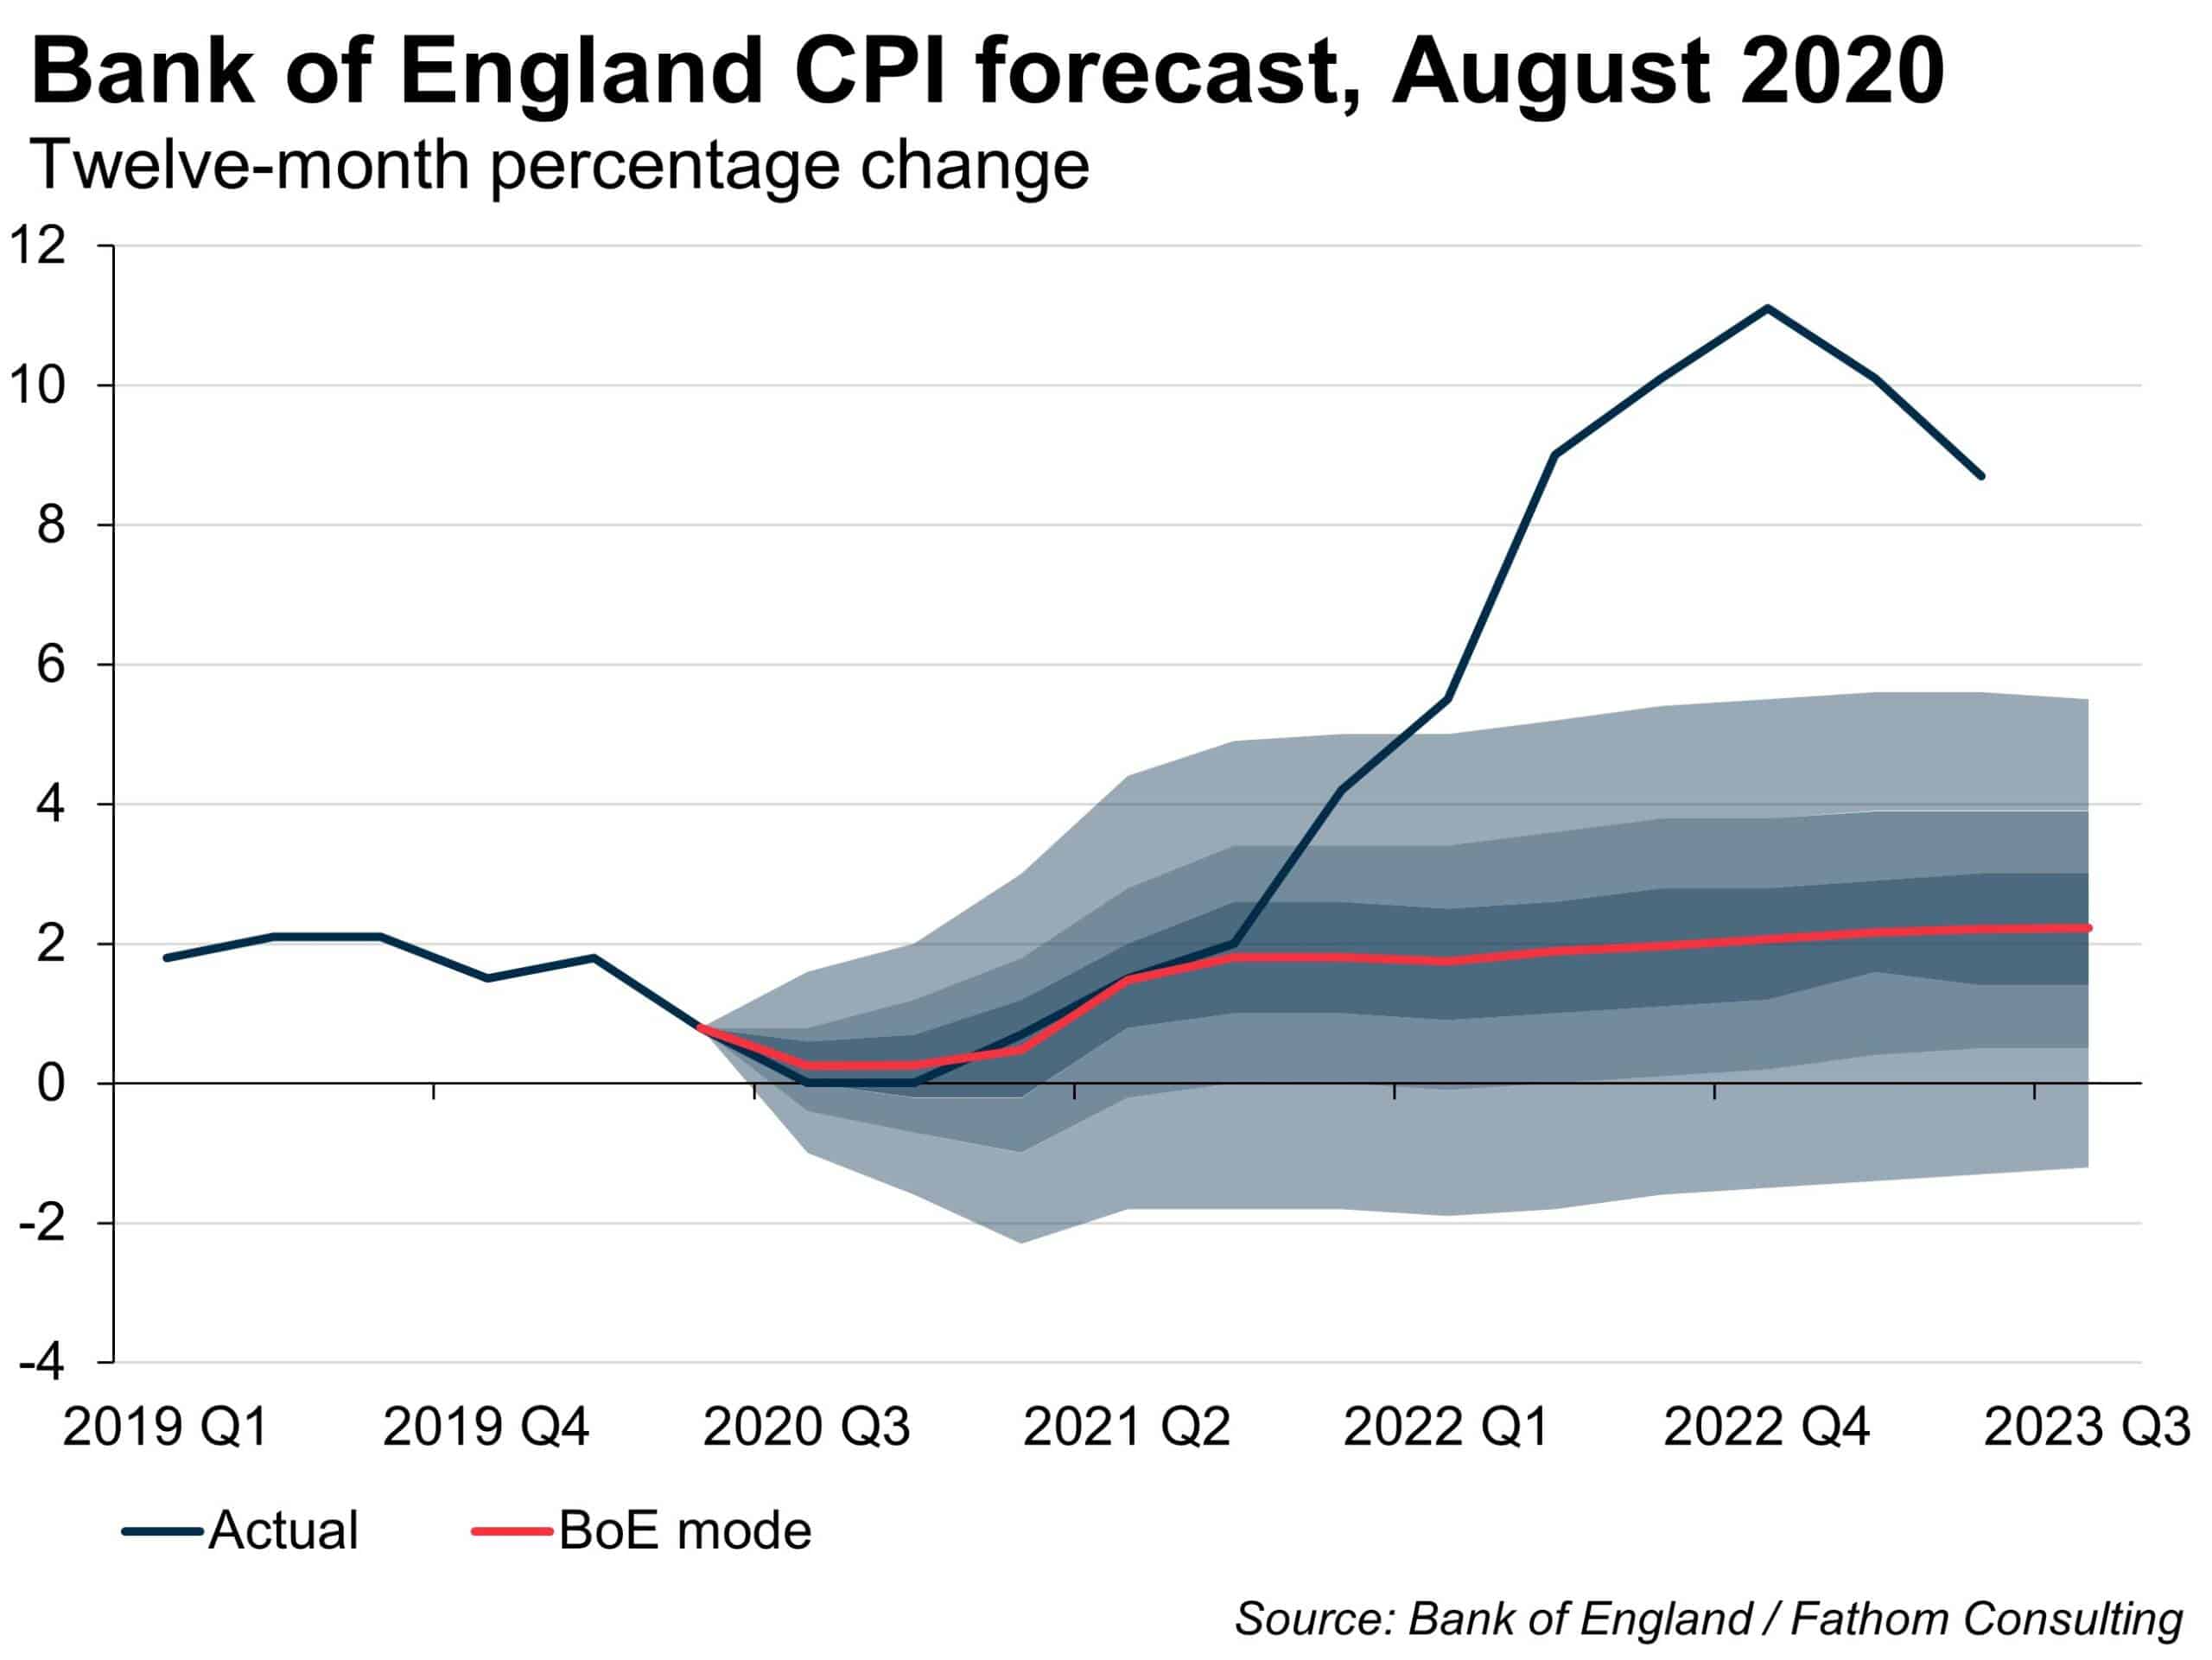
The Bank of England has just embarked on an independent assessment of its recent forecast performance. BEQM was ditched years ago, replaced, at least for a while, by something called COMPASS. It is not clear to me what forecasting model, if any, is deployed there at present as part of the forecast process.[1] The Bank’s recent forecast performance has been dire, persistently understating how high inflation would go and for how long. It is unlikely that the model (if there is one) is to blame: models don’t make forecasts, people do. A model, no matter how complex or arcane, is a tool, the kind of thing that is blamed for bad work by bad workers everywhere.
What’s the point of models then?
They help you see round corners.
Seeing round corners
The most important part of any forecast is an assessment of what is happening now: can you see the dog or not, so to speak. For example, can you see inflation in the data right now? There is a lot more to that question than just asking what the latest data are on CPI inflation. A decent forecaster will look at many measures of inflation: core and headline, imported and exported, input and output. They will examine consumer prices and producer prices and the GDP deflators, and the components of that. Wages and bonuses. Commodity prices. Survey measures of inflation expectations. Base effects. Baked-in pass-through. Changes in regulated prices, duties and taxes. A careful assessment of all of those measures, and more, is the fundamental discipline involved in forecasting inflation. And a good model will help you quickly to parse all those data, identifying discrepancies and the news in the most recent data compared to the previous vintage. A very mundane but important task.
But the next step is: what will happen round the corner? The dog will disappear, this much we know – hidden by the bricks that separate the past from the future. What have we to say about that?
If you wait long enough, the dog will probably reappear as it heads home. Most models have this property, known as ‘mean reversion’. A good model will tell you roughly when that is likely to happen (when the dog will be hungry), though there can be a lot of variation around that average. Important stuff, again, if boring.
The interesting bit is what happens when the dog is out of sight. Not what’s happening right now; not what will happen when everything comes back to the mean. What happens in between.
You can imagine all kinds of things. Just around the corner, the dog enters a bar and orders a couple of pints for itself and a horse that’s just strolled in. Or the dog sprouts wings and flies off into the distance. Or it heads off with hundreds of other dogs in cars to a big dog party at the top of a huge tree. It’s possible to imagine these things but, it has to be said, it’s unlikely that any of them will actually happen. How do we know this? Because those outcomes do not conform to our model of how dogs actually behave. Most likely, says our model, the dog will sniff around a bit, relieve itself a couple of times, maybe find something interesting to chew, have a couple of interactions with other dogs whose owners will probably tut and wonder why our dog is off the lead, and then mosey on home when it gets hungry.
Mean reversion behaviour in other words.
But what if, moments before the dog turned the corner, we saw a cat enter the same road? The cat has now disappeared from our view too, but we know it’s there somewhere. It might be out of sight to the dog; but then again it might not. What if it’s not? Then, says our model, the dog will probably chase the cat, for as long as it takes for the cat (which is faster) to get away or get up something high. Then the dog will hang around for a while barking, and the cat will look down smugly thinking to itself ‘the cat wins again’, reasserting the natural order of things that has been in place since the Pharaohs.
In this case, the dog could get much further away from the mean than it normally would. It could take ages to get back, and when it does return it will be much later than you’d otherwise expect. It might even get lost and never find its way back home. It might (heaven forbid) get run over on a road it doesn’t know. All of these ‘might-bes’ are made more likely by the presence of the cat.
A good model should allow you to see all of these might-bes. Of course, there might be a cat round the corner even if you didn’t see one. A good model will let you run through the what-ifs that capture that eventuality. But if you see the cat, then you will need to develop a central forecast that is conditioned on the presence of the cat.
Spotting the cat
To get back to the real world, everyone who was paying attention could see there was a cat involved in the outlook for UK inflation. The COVID pandemic damaged both the demand side and the supply side of the British economy. The demand side recovered rapidly and almost completely; the supply side did not. Brexit amplified that difference, as was once again extremely predictable. An excess of demand over supply will tend to pull inflation up and away from its target: that was the cat. At Fathom, we spotted the cat in March 2020, at the very beginning of the pandemic, and were alerting the world to its presence consistently after that. We didn’t foresee Russia’s pointless invasion of Ukraine — that cat was hidden. But it took the Bank of England far too long to accept that the impact of the pandemic, aggravated by Brexit, was inflationary. Once you let the dog chase the cat you risk losing control of it altogether. That is where we now are, and that’s why a review of their forecast process is needed.
Fathom was right, if anything, too early. We thought we could see something coming, with a high probability, so we told our clients immediately – but they mostly couldn’t use that information for another year or more. Judging when and how to convey information about the between phase, after the right now and before the long run, is a difficult skill. It can be useful to see round one corner, but usually not more than that.
The Bank, if they saw that risk round the corner, ignored it when putting their forecasts together.
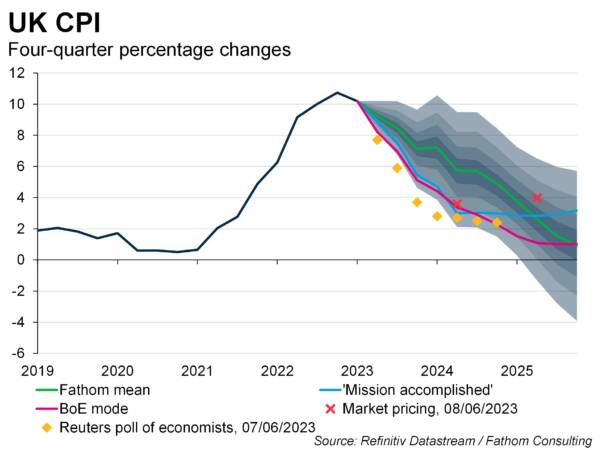
The cat is now safely up a tree, but the dog is far away from home. It will take a long time to return, if it ever does. The Bank is finally concerned about the medium-term risks to inflation, but it might be too late to do much about them — at least, not without causing a lot of pain.
Spoiler alert: Leacock’s story ends with the narrator happily handing all his money to Annerly in an attempt to communicate with the non-existent phantasm ‘Q’. Among the bad jokes about economists, there is one that goes: economists are people who spend their lives searching for a non-existent black cat in a dark room. Forecasters commit a worse sin: they find it.
Don’t find non-existent cats! That would make you a charlatan, to be discussed in the same breath as those who gaze into crystal balls. But this cat exists. We saw it.
I found the book I thought I needed in the Stoke Newington bookshop. Next to an entire wall devoted to Marxism and feminism and combinations thereof, there were a few shelves on new age religion, astrology and shamanism. Tucked in towards the bottom were a few books on economics, including (bizarrely) the one I was after: A Guide to UK Monetary Policy by Paul Temperton, if I remember correctly. It remains unread by me to this day.
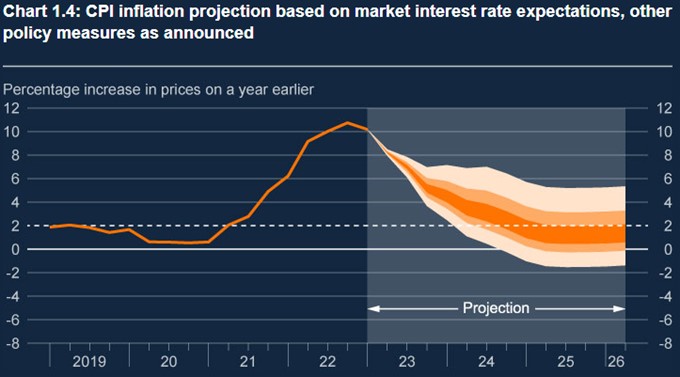
[1] And a personal gripe here, as the author of the first fan charts published anywhere: the current fan charts produced by the Bank are both ugly and misleading. First, they visually emphasise the variation in the horizontal axis (time) rather than the vertical axis (inflation), which is the wrong emphasis. Second, the dark background on which the fan is superimposed is both ugly to my eye and creates the false impression that there is a zero likelihood the out-turn will fall outside the extreme edges of the fan, which are paler-shaded — when in fact 20% of the distribution is in that (currently dark-shaded) area.
Not all change is bad, but this one is.
More by this author